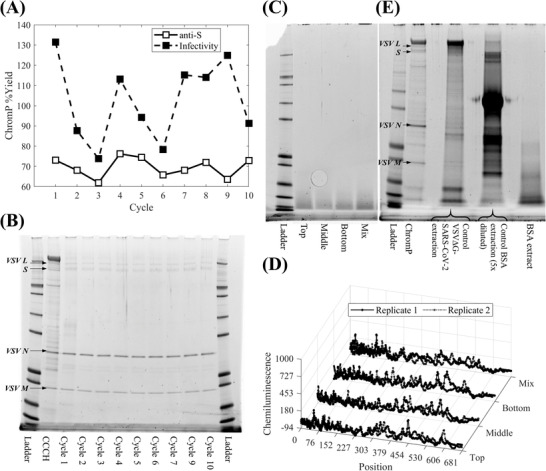
FIGURE 7.

Evaluation of the impact of cleaning in place strategy across ten resin re‐use cycles at the lab scale based on product yield and purity analysis and resin extract analysis: (A) Chromatography flowthrough product pool (ChromP) yields per cycle based on anti‐Spike (S) protein quantitative western blotting (□) and infectivity data (■); (B) SDS‐PAGE analysis of clarified cell culture harvest (CCCH) and ChromP per cycle (cycle 8 was excluded); (C) SDS‐PAGE analysis of resin extracts from resin samples collected at the end of the ten resin re‐use cycles from the top third of the bed volume (Top), the middle third of the bed volume (Middle), the bottom third of the bed volume (Bottom) and their mix (Mix); (D) Electropherograms from HCP quantitative western blotting analysis of resin extracts from the Top, Middle, Bottom, and Mix column resin samples; (E) SDS‐PAGE analysis of ChromP and control VSV∆G‐SARS‐CoV‐2 and BSA resin extracts. In (D) markers (○) and (□) denote analytical replicates and the electropherograms indicate the absence of HCPs in the tested extracts
