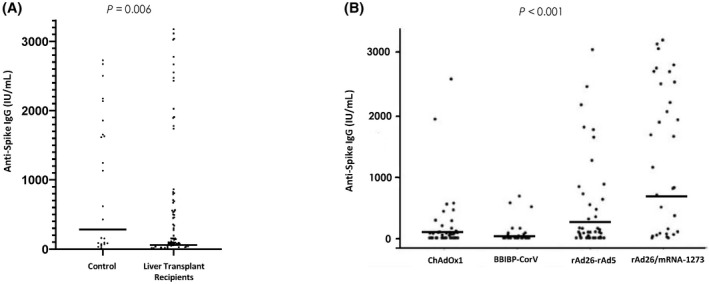
FIGURE 1.

Specific anti‐spike IgG concentration in healthy controls and liver transplant recipients. (A) Differences between liver transplant recipients and the control group were analyzed by the Mann‐Whitney U test. (B) Differences in liver transplant recipients according to vaccine regimens; statistical analysis was performed using the Kruskal‐Wallis test. Data show median (solid horizontal lines) and range. IgG, immunoglobulin G.
