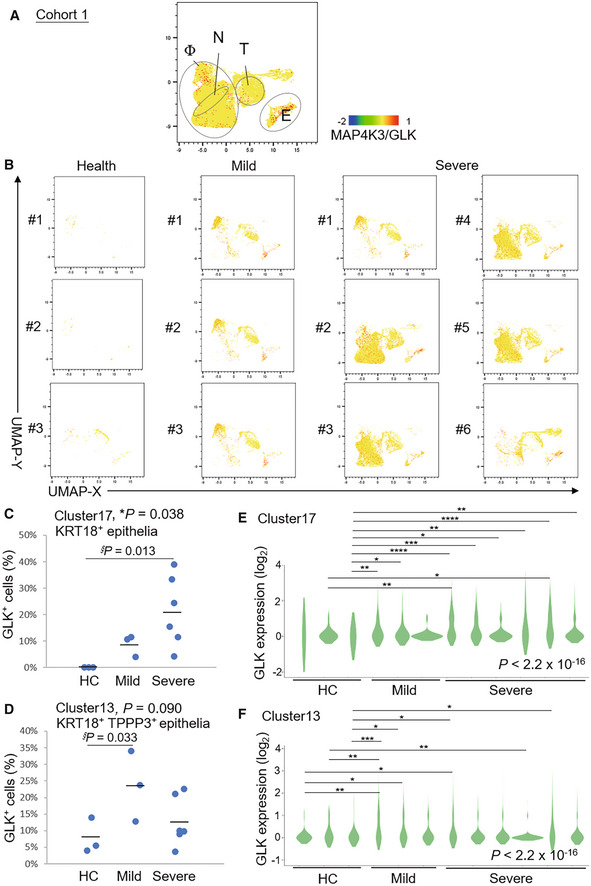
Figure 1. Induction of MAP4K3/GLK in epithelial cells of BALFs from COVID‐19 patients.

-
A, BDistribution and classification of MAP4K3/GLK‐positive cells in 20 ml BALFs of all 12 individuals (A), three healthy controls (HC, #1–#3), three mild COVID‐19 patients (#1–#3), and six severe COVID‐19 patients (#1–#6) (B) from Cohort #1. Data were shown in UMAP. Single‐cell gene expression of MAP4K3 (GLK) in individual cells was shown in color scale. Φ denotes macrophages; N denotes neutrophils; T denotes T cells; E denotes epithelial cells.
-
C, DThe percentages of MAP4K3/GLK‐positive KRT18+ epithelial (C) or KRT18+ TPPP3+‐ciliated epithelial cells (D) in BALFs from Cohort #1.
-
E, FGLK mRNA levels in KRT18+ epithelial (E) or KRT18+ TPPP3+‐ciliated epithelial cells (F) of Cohort #1. n (cell number) = 3, 14, 33 for HC; n = 65, 43, 74 for mild COVID‐19 patients; n = 164, 62, 10, 4, 74, 66 for severe COVID‐19 patients (E). n = 25, 43, 36 for HC; n = 209, 244, 141 for mild COVID‐19 patients; n = 189, 223, 330, 792, 80, 243 for severe COVID‐19 patients (F).
Data information: In (C, D), *, P‐value < 0.05 (ANOVA test); §, P‐value < 0.05 (Dunnett's test). In (E, F), *P‐value < 0.05; **P‐value < 0.01; ***P‐value < 0.001; ****P‐value < 0.0001 (Kruskal–Wallis test).
