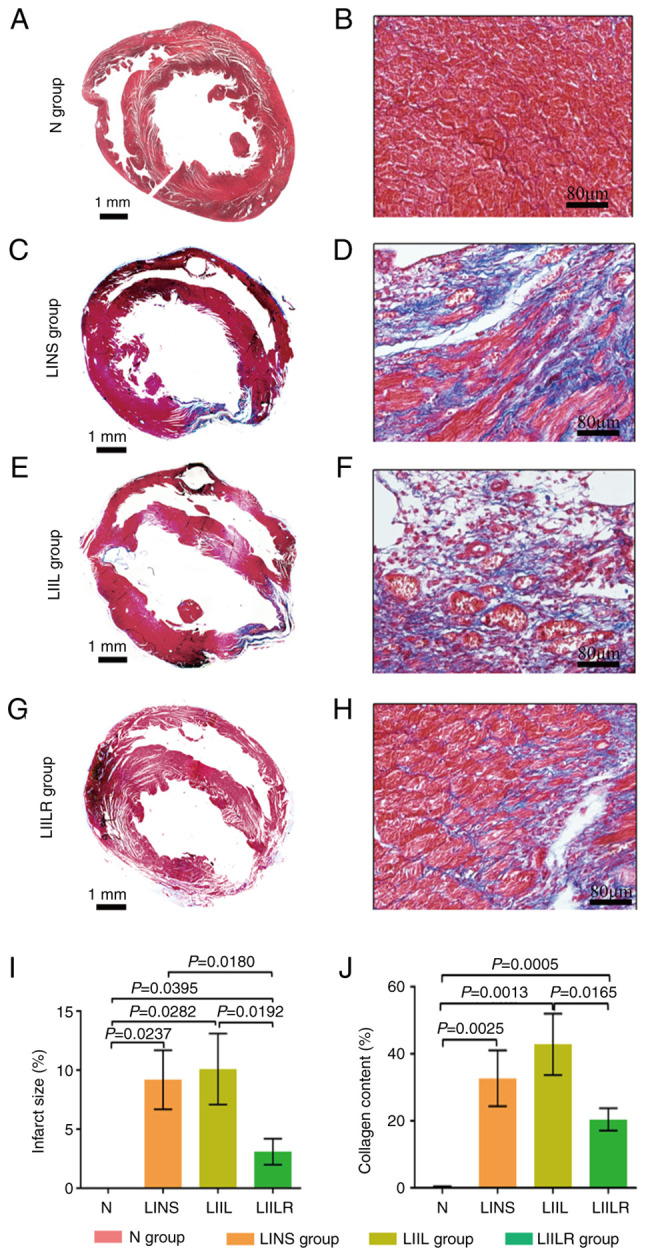
Figure 4.

Overall Masson staining and infarct size of the rat heart in the N group, and 2 weeks after myocardial infarction in the LINS group, LIIL group and LIILR group. Masson staining showing myocardial tissue fibrosis in rats. Cardiomyocytes were stained in bright red, collagen in dark blue. (A) Overall Masson staining of the N group. (B) Magnified Masson staining of the N group. (C) Overall Masson staining of the LINS group. (D) Overall Masson staining of the LINS group. (E) Magnified Masson staining of the LIIL group. (F) Magnified Masson staining of the LIIL group. (G) Magnified Masson staining of the LIILR group. (H) Magnified Masson staining of the LIILR group. (I) Quantification of infarct size percentage in each rat group. (J) Quantification of collagen content percentage in each rat group. Left column scale bar, 1 mm; right column scale bar, 80 µm. N group, n=20; LINS group, n=13; LIIL group, n=10; LIILR group, n=18. N group, normal control group; LINS group, LAD ligation with an injection of normal saline; LIIL group, LAD ligation with an injection of IL-6 recombinant protein; LIILR group, LAD ligation with injection of IL-6 receptor inhibitor group.
