
Figure 1.
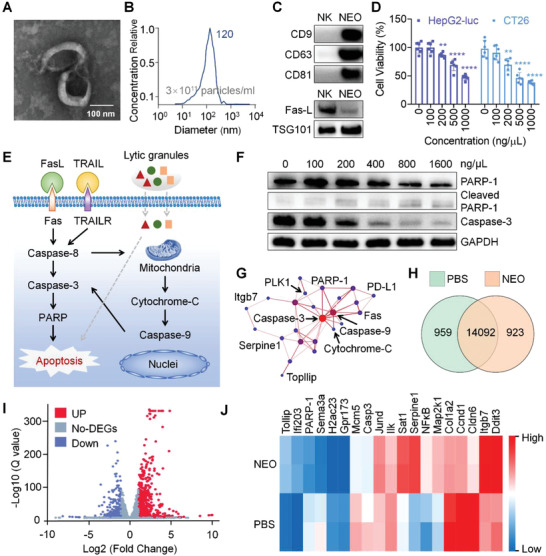
Comprehensive characterization of NK‐derived exosome (NEO). A) Transmission electron microscopes (TEM) image of NEO. Scale bar, 100 nm. B) Particle size distribution of NEO recorded by NTA. C) Western blot analysis of CD9, CD63, CD81, Fas‐L, TSG101 in NEO. D) Cytotoxicity of NEO evaluated in HepG2‐Luc and CT26 cells. **p < 0.01, ****p < 0.0001. E) Proposed regulation pathways of NEO toward cancer cells. FasL, Fas ligand; TRAIL, TNF‐related apoptosis‐inducing ligand; PARP1, poly (ADP‐ribose) polymerase 1. Representative lytic granules include perforin, granzymes, granulysin, etc. F) Western blot analysis of crucial proteins involved in apoptosis pathway. The concentrations of NEO were 0, 100, 200, 400, 800, 1600 ng µL−1, respectively. G) Protein−protein interaction networks, as determined from RNA‐seq data. H) A Venn diagram revealed the number of genes transcribed in PBS and NEO treated CT26 cells. I) Volcano plots displayed the up expressed (red) and down expressed (blue) genes. Genes that were not differentially expressed were denoted as no‐DEGs. J) A heat map of gene transcriptions of interest.