
Figure 3.
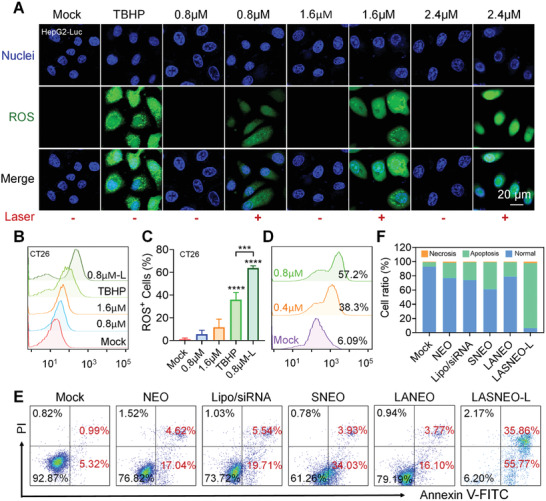
The photogeneration and biological effects of ROS in LASNEO‐treated cells. A) ROS levels in HepG2‐Luc cells after treating with LASNEO at different Ce6 concentrations (0.8, 1.6, and 2.4 µm). The ROS was stained with DCFH‐DA, and cells treated with ROS‐up solution were used as positive controls (TBHP). Scale bars, 20 µm. B) FACS determination of ROS production in CT26 cells. C) Quantitative analysis of (B) (n = 3). ***P < 0.001; ****P < 0.0001. D) FACS analysis of CD86 (M1 macrophage marker) expression on macrophages before and after treating with different concentrations of LASNEO and laser irradiation. E) FACS‐recorded apoptosis in CT26 cells after treating with LASNEO. The cells were stained with Annexin V‐FITC and PI. F) Quantitative analysis of (E). The assays in (A), (B), and (E) were repeated in triplicate.