
Figure 4.
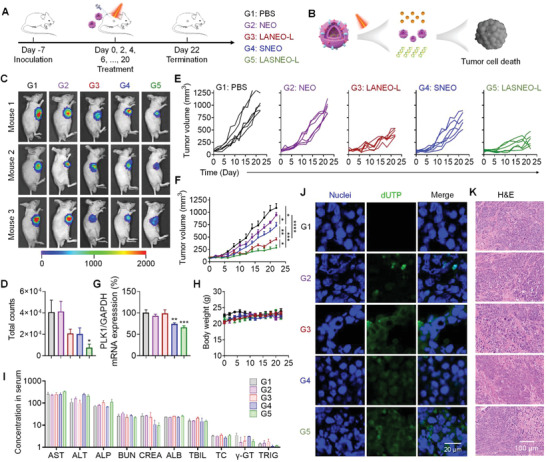
In vivo antitumor efficacy of LASNEO in HepG2‐Luc cell line xenograft tumor model. A) Treatment schedule and grouping information. Six animals were used in each group. B) Schematic illustration of the treatment principle. C) Bioluminescence imaging of the mice receiving different treatments. D) Quantitative analysis of all living mice receiving various treatments. E) Individual and average F) tumor volumes recorded during the treatment course. G) PLK1 mRNA expression in tumor tissues recorded at the end of experiment. H) Body weights recorded during the treatment course. I) Serum biochemistry parameters were analyzed at the end of treatment. Ten indicators were analyzed, including aspartate aminotransferase (AST, U L−1), alanine aminotransferase (ALT, U L−1), alkaline phosphatase (ALP, U L−1), blood urea nitrogen (BUN, mg dL−1), serum creatinine (CREA, µmol L−1), albumin (ALB, g L−1), total bilirubin (TBIL, µmol L−1), total cholesterol (TC, mmol L−1), γ‐glutamyl transpeptidase (γ‐GT, U L−1), Triglyceride (TRIG, mmol L−1). J) CLSM images of tumor cryosections prepared with tumors collected at the end of experiment. Sections were stained with DAPI and FITC‐labeled phalloidin. The scale bar was 20 µm. K) H&E staining of the tumor sections. The scale bar was 100 µm. *p < 0.05; **p < 0.01; ***p < 0.001; ****p < 0.0001.