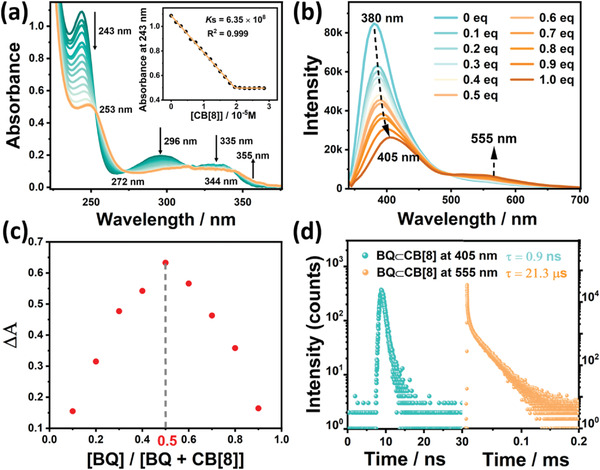
Figure 1.

a) UV–vis absorption spectra and absorbance intensity changes of BQ at 243 nm (inset) upon addition of CB[8] in H2O at 298 K ([BQ] = 1.5 × 10⁻⁵ m and [CB[8]] = 0−3.0 × 10⁻⁵ m). b) PL emission spectral changes of BQ upon addition of 0, 0.1, 0.2, 0.3, 0.4, 0.5, 0.6, 0.7, 0.8, 0.9, and 1.0 equivalent CB[8] in H2O at 298 K ([BQ] = 3.0 × 10⁻⁵ m, λ ex = 300 nm). c) Job's‐plot showing the 1:1 stoichiometry of the complex between BQ and CB[8] by UV titration. d) Time‐resolved PL decay spectra of BQ⊂CB[8] at 405 and at 555 nm in H2O at 298 K.
