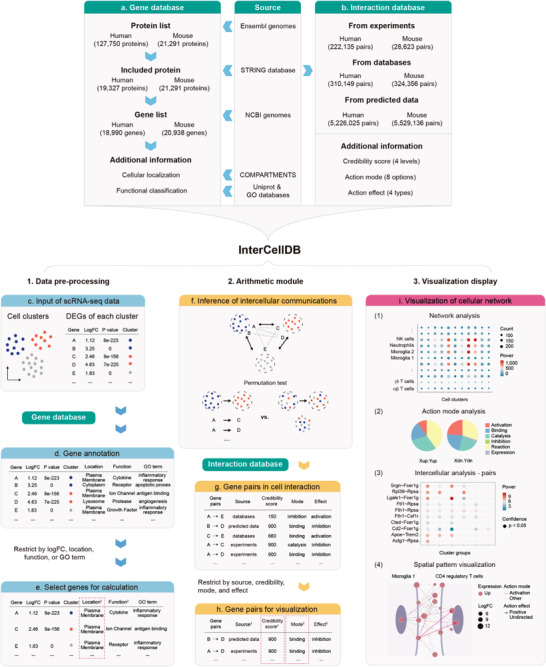
Figure 1.

Overview of InterCellDB database and workflow. a,b) InterCellDB integrates public databases to generate analytic tools. c–i) Routine workflow of InterCellDB: data preprocessing (c–e), arithmetic module (f–h), and visualization display (i). It starts from differentially expressed genes (DEGs) and corresponding cell clusters annotation (c). All the DEGs were annotated with their cellular localization, functional classification, and their attribution in GO terms (d). Customized DEGs were selected by setting three modules, including gene expression, cellular localization, and functional feature (e). Permutation test was performed to calculate the confidence of interaction (f). Each gene pair was annotated with evidence sources, credibility score, action mode, and action effect by matching to the interaction database (g). Customized gene pairs were generated by setting evidence source, credibility score, action mode, and action effect for further visualization (h). Visualization of cellular network (i) including network analysis (i(1)), action mode analysis (i(2)), intercellular analysis (i(3)), and spatial pattern visualization (i(4)). 1 “Location” annotated genes with 13 types of cellular localization and the red dashed box showed the example for selecting proteins located in plasma membrane. 2 “Function” annotated genes with 132 types of functional features. 3 “Source” provided evidence sources including experimentally validated, pathway curated, and predicted. 4 “Credibility score” ranged from 1 to 1000 (larger means more credible) and had four confidence levels by cutting off at 400/700/900. The red dashed box showed the example for selecting proteins with credibility score 900. 5 “Mode” was action mode, referring to functional interplay between two proteins. The red dashed box showed the example for selecting proteins with action mode of binding. 6 “Effect” was action effect, referring to expression changes caused by one protein when it interacted with another protein.
