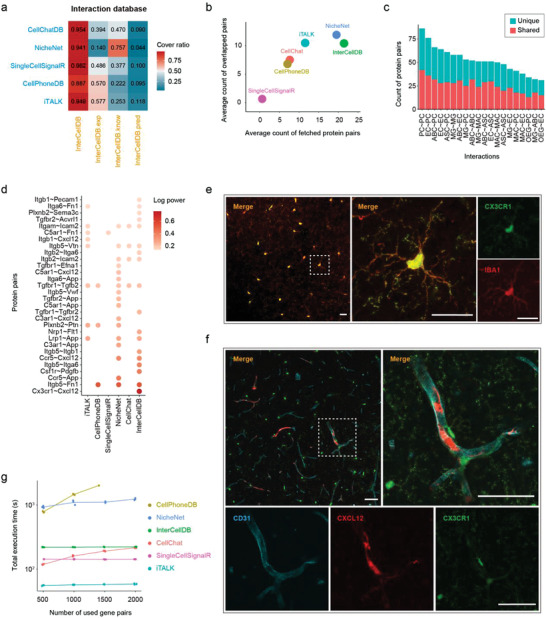
Figure 4.

Comparison between InterCellDB and other analytical tools. a) The coverage ratios of gene pairs generated by InterCellDB to the gene pairs from other methods. The whole database is split to three sub‐databases: InterCellDB.exp: experimentally validated gene pairs, InterCellDB.know: pathway curated gene pairs, InterCellDB.pred: predicted gene pairs. b–e) we employed scRNA‐seq data on mouse brain as a testing dataset to evaluate the breadth and accuracy of inference results by InterCellDB comparing with the other methods. b) The breadth of inference results by InterCellDB comparing with other methods. The x‐axis indicates the average count of predicted protein pairs by one method, and the y‐axis indicates the average number of consistently predicted protein pairs among these methods. c) Count of predicted protein pairs by InterCellDB and other methods. Red bar denotes the number of protein pairs predicted by InterCellDB and at least one of other methods. Blue bar denotes the count of those uniquely identified by InterCellDB. d) Top predicted protein pairs by any of these methods for crosstalk between microglia and endotheliocytes. e,f) Representative confocal micrographs showing the brain slices of CX3CR1‐GFP mice. Scale bars = 40 µm. e) Red: IBA1 positive cells, Green: CX3CR1 positive cells. f) CX3CR1 positive cells (Green) locate near the CXCL12‐expressing CD31 positive cells (colocalization of Red and Cyan). g) Running time of all methods under the same settings. ABC, arachnoid barrier cells; ASC, astrocytes; EC, endothelial cells; MAC, macrophages; MG, microglia; OEG, olfactory ensheathing glia; and PC, pericytes.
