
Figure 2.
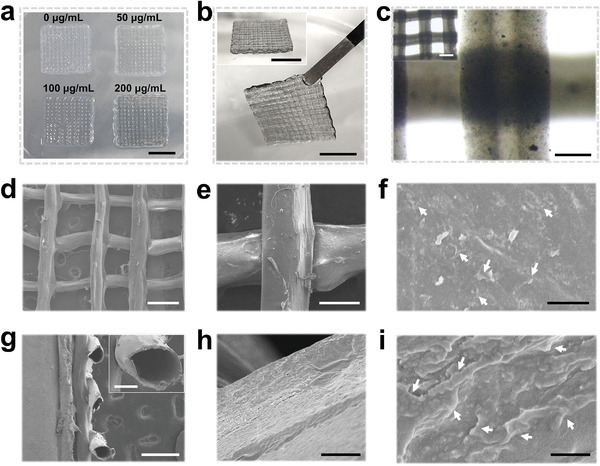
Characterization of MX‐HF scaffolds. Photographs of a) MX‐HF scaffolds with different MXene contents (MXene concentration in the hydrogel precursor: 0, 50, 100, and 200 µg mL−1). Scale bar indicates 1 cm. b) Photographs of the different views of the hollow fibrous scaffolds (MXene content: 200 µg mL−1). Scale bars indicate 1 cm. c) Optical micrographs of the hollow scaffolds with straight channels. Scale bars indicate 200 and 500 µm (inset). d–f) Top and g) section views of the scanning electron microscope (SEM) images of the freeze‐dried MX‐HF scaffolds at different magnifications. h,i) The high‐resolution SEM images of the scaffold channels indicated the incorporated MXene nanosheets within the MX‐HF scaffolds. The white arrows in (f) and (i) indicate the nanosheets incorporated in the scaffold matrix. Scale bars indicate 500 µm in (d) and (g), 150 µm in (e), 100 µm in (g) (inset), and 5 µm in (h), 2 µm in (f), and 500 nm in (i).