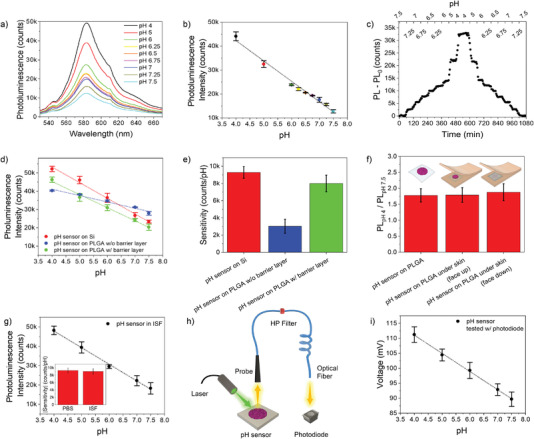
Figure 2.

Assessment of the bioresorbable pH sensor in vitro. a) Photoluminescence spectra of the bioresorbable pH sensor measured in the pH range 4–7.5 in PBS at 37 °C. b) Calibration curve (photoluminescence intensity at 580 nm versus pH value) of the bioresorbable pH sensor measured over the pH range 4–7.5 in PBS at 37 °C (n = 3 pH cycles). c) Real‐time measurement of the photoluminescence intensity of the pH sensor at different pH values from 7.5 to 4, and back, in PBS at 37 °C. pH variation in the physiological range 6.5–7.5 is of 0.25 points. d) Calibration curve of the pH sensors in different configurations, namely, LbL‐coated nPSiO2 on native silicon chip (red) and on a PLGA film (blue), LbL‐coated nPSiO2 with barrier layer on a PLGA film (green) (n = 3 pH cycles). e) Sensitivity values of the sensors in (d) (n = 3 samples, 3 full cycles per sample). f) Photoluminescence intensity changes between pH 4 and 7.5 measured on the pH sensor in solution and between artificial skin flaps in two different configurations. (n = 3 samples per architecture, 3 full cycles per sample). Two‐tailed Student's t‐test (significance level < 0.01) confirmed that data were statistically equivalent. g). Calibration curve (photoluminescence intensity at 580 nm versus pH value) of the bioresorbable pH sensor measured over the pH range 4–7.5 in ISF at 37 °C (n = 3 pH cycles). Inset show the comparison of sensitivity values of the pH sensor in PBS and ISF (n = 3 samples, 3 full cycles per sample). h) Sketch of the setup used to perform pH sensing with a compact and cheap light source‐photodiode pair. i) Calibration curve (photodiode response versus pH value) of the bioresorbable pH sensor in the range of pH 4–7.5 measured with the setup in h) (n = 3 samples, 3 full cycles per sample). Data are presented as mean (± s.d).
