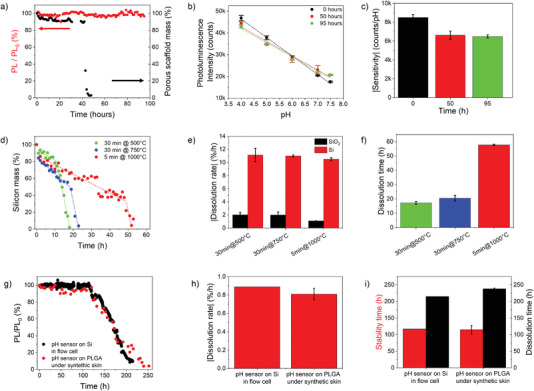
Figure 3.

Long‐term operation of the bioresorbable pH sensor. a) Normalized photoluminescence intensity (red, at 580 nm) and mass of the porous scaffold (black) measured over ≈100 h on a pH sensor in buffer at pH 7.4 and 37 °C. b) Calibration curve (photoluminescence intensity at 580 nm versus pH value) of the pH sensor in (a) measured over the pH range 7.4–4 at t = 0, 50, and 95 h (n = 3 full cycles). c) Sensitivity value of the pH sensor in (b). d) Mass percentage of nPSiO2 scaffolds oxidized in different conditions measured over time until full dissolution. The raw data are best‐fitted using a piecewise linear model (dotted traces). e) Dissolution rate of the SiO2 capping layer and silicon skeleton of the nPSiO2 scaffolds in (d) (n = 4 samples). f) Full dissolution time of the nPSiO2 scaffolds in (d) (n = 3 samples). g) Time‐resolved normalized photoluminescence intensity (at 580 nm) of pH sensors on native Si in a flow cell and on PLGA foil under synthetic skin. h) Degradation rate (after 110 h of stable operation) of the photoluminescence of pH sensors on native Si in flow cell and on PLGA foil under synthetic skin (n = 3 samples). i) Photoluminescence stability and degradation times of pH sensors on native Si in flow cell and on PLGA foil under synthetic skin (n = 3 samples). Data are presented as mean (± s.d).
