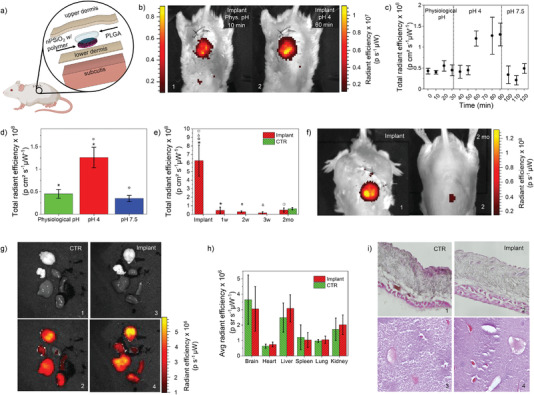
Figure 4.

Assessment of pH sensing in vivo, bioresorbability, and biocompatibility. a) Sketch of the pH sensor implant in the animal model. b) In vivo fluorescent images acquired through skin on one of the animals implanted with the sensor on their back (excitation 520–560 nm, collection 620 nm), collected in 1) physiological conditions and 2) after local injection of a PBS solution at pH 4. c) In vivo real‐time fluorescence intensity signal measured through skin on mice implanted with the sensor, acquired in physiological conditions and after injection of PBS at pH 4 and 7.5 around the implant site (n = 3 mice). d) In vivo steady‐state fluorescence intensity measured through skin on mice implanted with the sensor, acquired in physiological conditions and after injection of PBS at pH 4 and 7.5 around the implant site (n = 3 mice). Symbols indicate statistically independent values (two‐tailed Student's t‐test, significance level <0.01). e) In vivo fluorescence intensity measured through skin on mice implanted with the sensor (n = 3 mice) and control mice (n = 5 mice) at different time points, before sacrifice. Symbols indicate statistically independent values (two‐tailed Student's t‐test, significance level <0.01). f) In vivo fluorescence images acquired through skin right after implant and after 2 months from implant. g) In vivo grayscale and fluorescent images of explanted organs (brain, heart, liver, spleen, lung, and kidney) of control mice (n = 5 mice) and mice implanted with the sensor (n = 6 mice), acquired after 2 months from implant. h) Mean fluorescence intensity of each organ in g) for the two groups of mice (control and implanted with sensor). i) Optical microscope images of skin (1,2) and liver (3,4) cryosections labeled with eosin and hematoxylin staining of a control mouse and a mouse implanted with the sensor after sacrifice at 2 months from implant. Data are presented as mean (± s.d).
