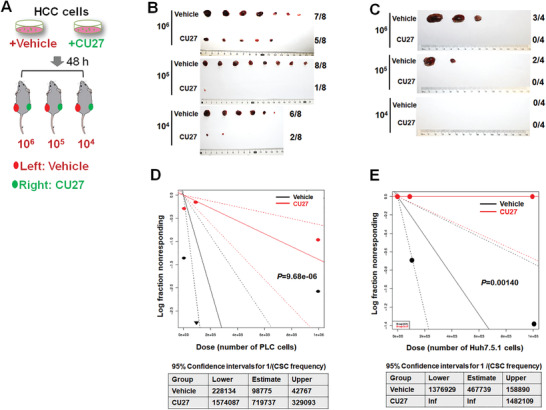
Figure 3.

In vivo limiting dilution assay of CU27‐treated HCC cells. A) Schematic diagram of in vivo limiting dilution assay. B,C) PLC cells‐derived (B) and Huh7.5.1 cells‐derived (C) tumors dissected from two flanks of xenografted mice. D.E) Liver CSC frequency analysis by extreme limiting dilution analysis (ELDA) software.[ 29 ] A plot of the log proportion of nonresponding versus the number of cells, the slope of the line representing the estimated log‐liver CSC fraction and the dotted lines give the 95% confidence interval. The value with zero negative response at dose 100 000 in vehicle is represented by a down‐pointing triangle (top). The estimated frequency and its 95% confidence intervals displayed in table (bottom).
