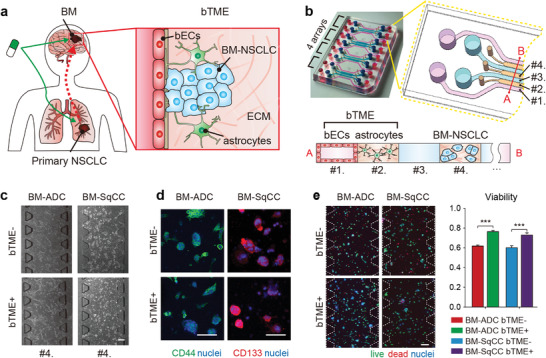
Figure 1.

Schematic illustration of brain metastatic niche of NSCLC cells and microfluidic device for recapitulating the niche. a) The brain metastatic niche involving bTME with bECs and astrocytes. b) Representative photography and drawing of the microfluidic device with seven channels, and its cross‐sectional illustration with three types of cells. c) Phase‐contrast images of tumor cells monocultured (bTME‐) and co‐cultured (bTME+) in a microfluidic device. d) Representative fluorescence images of patient tumor cells of cancer stemness markers. e) Representative fluorescence images of patient tumor cells tagged by live/dead kit (left), and measured viability (right). Scale bars indicate 200 µm. The viability data presented as average values ± SEM, n = 65 for BM‐ADC and n = 21 for BM‐SqCC.
