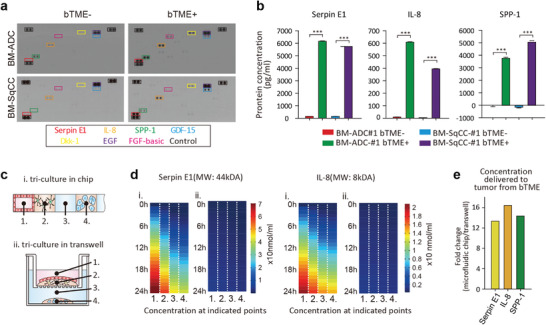
Figure 3.

Cytokines elevated via microfluidic tri‐culture. a) Cytokine profile. Dots in the black boxes are references. b) Protein concentration measured in conditioned media extracted from microfluidic channel #3 with or without bTME. c) Schematic illustration for protein concentration simulation secreted from the cells in region 1, tri‐cultured in (i) a microfluidic device or (ii) Transwell. d) Simulated concentration of two proteins (large Serpin E1 and small IL‐8) in (i) a microfluidic device and (ii) Transwell. e) Ratio of concentration delivered to tumor cells in channel #4 in 24 h in a microfluidic chip to Transwell.
