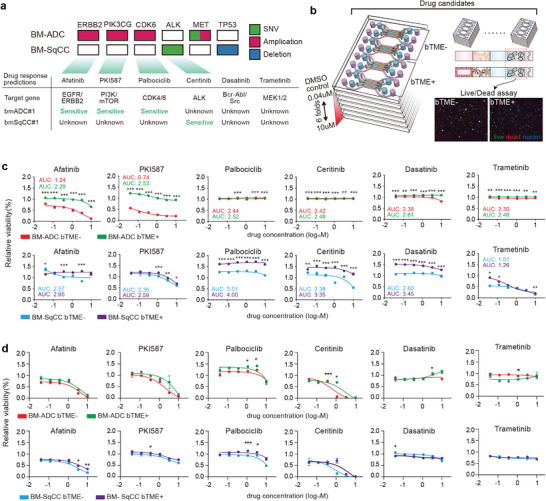
Figure 5.

Drug screening in microfluidic chips. a) DNA mutation of BM‐NSCLC and DNA‐based drug response prediction. b) Schematic illustration of drug screening process using microfluidic chip. c) Drug response graphs calculated for tumor response with/without bTME using microfluidic chip. d) Drug response graphs using Transwell (*p < 0.05, **p < 0.01, and ***p < 0.001 coculture versus monoculture at each drug concentration).
