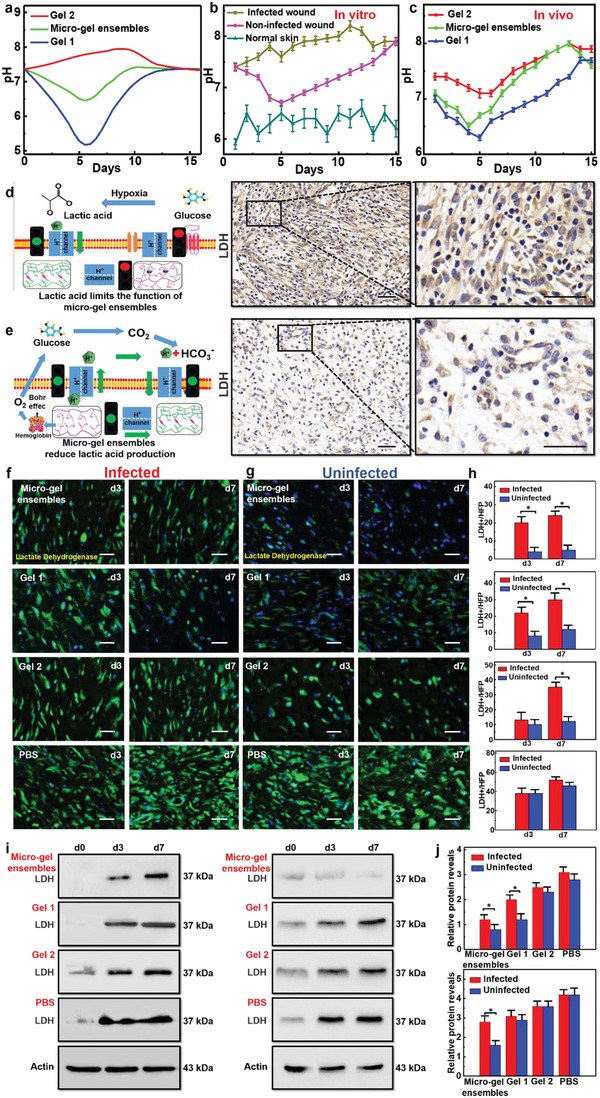
Figure 3.

pH regulation of micro‐gel ensembles. a) The curves of the in vivo pH values of infected wounds, non‐infected wounds, and normal skin wounds with healing time. b) The curves of the in vitro pH values of Gel 1, micro‐gel ensembles, and Gel 2 with time. Bars represent standard error, n = 5. c) The curves of the in vivo wound pH values of Gel 1, micro‐gel ensembles, and Gel 2 with healing time. Bars represent standard error, n = 5. d) Schematic illustration of lactic acid affects pH regulation, which due to insufficient oxygen supply. e) The principle of micro‐gel ensembles to reduce lactic acid and achieve accurate pH control. Scale bars of (d) and (e) are 50 µm. f) The lactic acid (green) fluorescence staining of the granulation tissue on the third and seventh day of infected S. aureus. g) The above experimental results of uninfected group. Scale bars of (f) and (g) are 20 µm. n = 5 per group. h) The changes of lactate dehydrogenase (LDH) content at different times. Data were shown as mean values ± SD. Bars represent standard error, n = 5 per group. *p < 0.05. i) The expression levels of granulation tissue in different groups as detected by Western blot analysis (WB). j) WB gray values of granulation tissue after treating wounds with different materials. Data were shown as mean values ± SD. Bars represent standard error, n = 5 per group. *p < 0.05.
