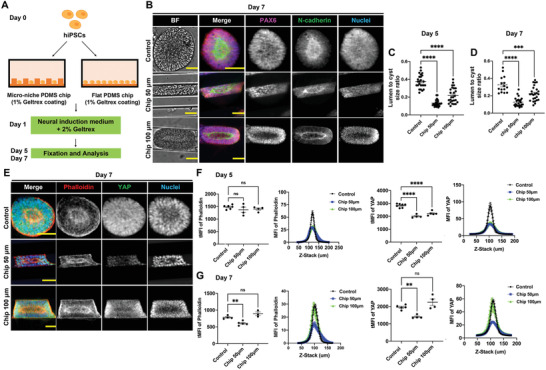
Figure 6.

3D microniches guide NE cyst formation. A) Schematic of growing hiPSC on PDMS chips with linear grooves microniche and control flat PDMS chip to generate NE cysts. B) NE cysts growing on PDMS chip with linear grooves microniche of either 50 µm (Chip 50 µm) and 100 µm (Chip 100 µm) in width or 90 µm in height. Flat PDMS chip was used as control. Bright‐field images and immunofluorescence staining of N‐cadherin and PAX6 in NE cysts on day 7. Scale bars: 50 µm. C,D) Quantification lumen‐to‐cyst size ratio of NE cysts on (C) day 5 and (D) day 7, n ≥ 15. E) Immunofluorescence staining of F‐actin (phalloidin) and YAP in NE cysts growing on PDMS chip with linear grooves microniche of different dimensions (Chip 50 µm, Chip 100 µm) and control PDMS chip with flat surface on day 7. Scale bars: 50 µm. F,G) Quantification of F‐actin (phalloidin) and YAP intensity in NE cysts on (F) day 5 and (G) day 7, n ≥ 4. Total mean fluorescence intensity (MFI) of F‐actin (phalloidin) and YAP were shown as dot plots (left) and the corresponding MFI of each slide along the Z‐stack were indicated as curve graphs (right). Error bars in (C), (D), (F), and (G) represent S.E.M. P‐values of statistical significance were represented as: * P < 0.05, ** P < 0.01, *** P < 0.001, **** P < 0.0001, using one‐way analysis of variance (ANOVA) followed by Dunnett multiple comparisons test.
