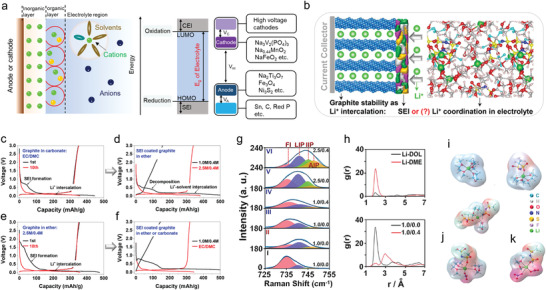
Figure 9.

SEI theory and solvation theory. a) Illustration of SEI in a battery. b) Schematic view of the two proposed models to explain the stability of a graphite anode in an Li ion battery. c–f) SEI mediated electrochemical performance. g) Raman spectra of S‐N‐S bending motions for TFSI− in an electrolyte using I) DME, II) DOL, and III–VI) DOL/DME as solvents. h) Top: RDF of Li+ to the oxygen of DME and DOL; Bottom: RDF of Li+ to the oxygen of TFSI− in the electrolytes with (red) and without (black) NO3. i,j,k) Schematic view of the first shell of Li+ in different solvents, where DME is the dominant solvent component. Reprinted with permission. [24 ] Copyright 2018, American Chemical Society.
