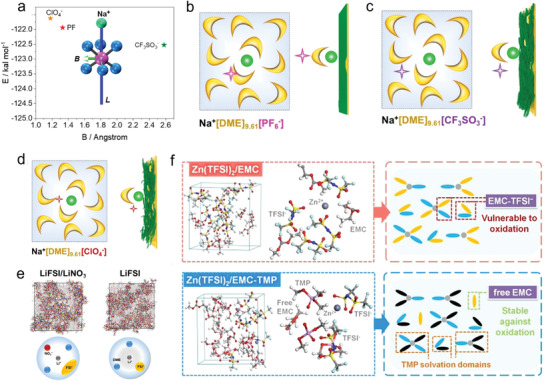
Figure 11.

Reported examples effect of anion on the solvation structure. a) Typical model of anion, demonstrating the Na+‐anion/solvent binding energy (L) and the half distance between the adjacent anion/solvent (B). Anionic interfacial model describing the electrolyte‐sodium anode interface. The model for 1.0 m DME‐based electrolyte using different metal salts including b) NaPF6, c) NaCF3SO3, and d) NaClO4, respectively. Reproduced with permission. [36 ] Copyright 2020, American Chemical Society. e) The solvation structure change induced by addition of NO3 − anions. Reproduced with permission. [83 ] Copyright 2019, American Chemical Society. f) The influence of TMP for TFSI− anions (Zn, violet; O, red; N, blue; C, gray; S, yellow; F, cyan; H, white). Reproduced with permission. [87 ] Copyright 2020, Wiley VCH.
