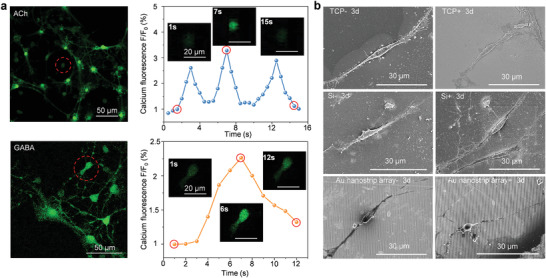
Figure 4.

Evaluation of the functional neurons. a) Calcium dynamics within the differentiated neurons seeded on Au nanostrip array and cultured with rotating magnetic field (300 rpm) for 5 days (calcium ion indicated in green). Left panels show images of neurons after calcium dye (Fluo‐4 AM) loading. Right panels show time‐series imaging of relative fluorescence intensity change (%ΔF/F) for individual neurons after stimulation by acetylcholine (ACh) or g‐aminobutyric acid (GABA) neurotransmitters. The inset shows the fluorescence intensity expression of the cell body in the selected region at different time points. b) SEM images of the differentiated neurons on TCP, Si, or Au nanostrip array, cultured without or with rotating magnetic field (300 rpm) for 3 days.
