Figure 1.

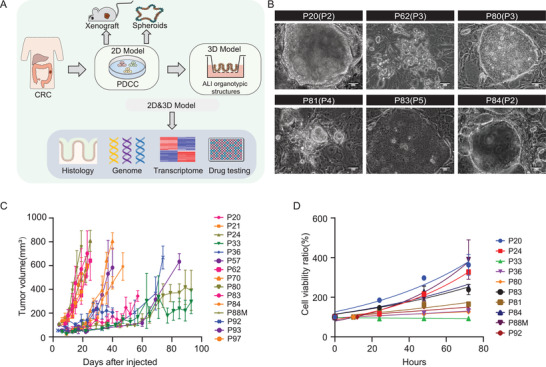
Establishment of CRC patient‐derived 2D PDCCs. A) Overview of experimental design. 2D PDCC lines were derived from CRC tissues; 3D ALI organotypic cultures, spheroids, and xenografts were generated from PDCC lines. The combined 2D and 3D culture system is called “a 2D and 3D model,” which can reflect patient‐specific characteristics at multiple levels, including histology, genome, transcriptome, and drug response. B) Representative bright field microscopy images of PDCC colonies. Passage numbers were marked in brackets. Scale bar: 50 µm. C) Tumor growth curves of 15 PDCC lines. 106 cells were subcutaneously injected to five to six BALB/c nude mice for each PDCC line. Each line indicates one PDCC line, error bars indicate SD. D) Growth behavior of PDCCs in vitro. Quantification of the ratio of the number of cells counted per well at each time point to the number of cells at time point 0 of the same PDCC line (n = 10). Results are expressed as mean ± SD of three independent cultures. Figure 1A created with BioRender.com.
