Figure 3.

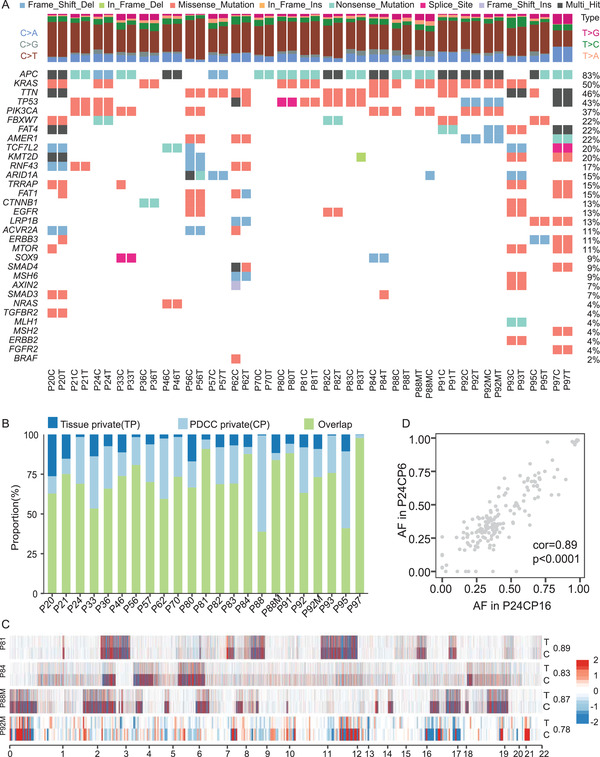
PDCCs maintain genomic landscape of corresponding tumors. A) Somatic mutations found in CRC related genes are present and conserved between paired PDCCs and parental tumor (T, tissues; C, PDCCs). Mutation type is indicated in the legend. The allele frequencies of these genes are listed in Figure S3E of the Supporting Information. n = 23, different patient samples. B) Bar plot of the concordance analysis of all SNVs detected in the PDCC lines and corresponding tissues. C) Heatmap visualization of inferred log R ratio (LRR) of CNAs comparing PDCCs and tissues. Numbers on the right side indicate the Pearson correlation coefficient for each pair of samples. Red denotes copy number gains, blue denotes copy number loss. D) Scatter plot comparing the somatic mutant fraction of SNVs for short‐time (passage 6) and long‐time culture (passage 16) of P24. Cor = 0.89; p < 0.0001. Correlations and p values are calculated by Pearson's correlation method.
