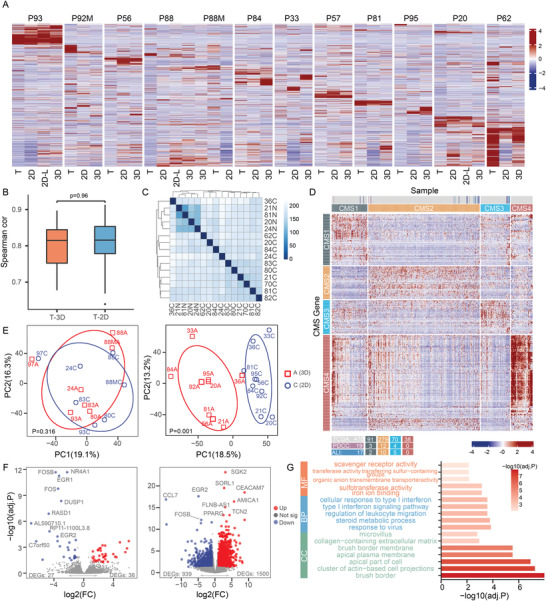
Figure 4.

Transcriptome profiles of PDCCs, ALI organotypic cultures and matched primary tumors. A) Heatmap of 2000 highly variable genes between PDCCs (2D), ALI organotypic cultures (3D), and tumor tissues (T) in RNA‐seq expression data. 2D‐L denotes long‐term cultured 2D PDCCs. P93: after 10 passages; P88: after 10 passages; P20: after 20 passages. n = 12, different patient samples. B) Spearman correlation based on overall gene expression level between tumor tissues and ALI organotypic cultures (T‐3D; cor = 0.79 ± 0.06), as well as between tumor tissues and PDCCs (T‐2D; cor = 0.8 ± 0.07). Value represents the mean ± SD. n = 12, different patient samples. The p‐value is determined by PERMANOVA test. No significant difference between them (p = 0.96). C) Correlation heatmap of PDCCs from 11 different patients and four NSCs. Samples are color coded by distance. C) PDCCs; N, NSCs. D) The consensus molecular subtypes in PDCCs and ALI organotypic cultures. RNA‐seq data of 19 PDCC lines, 17 ALI organotypic cultures are normalized and combined with 478 TCGA CRC samples. The distribution of PDCCs and ALI organotypic cultures among TCGA are indicated by colored lines. E) PCA shows that seven matched 2D and 3D pairs were clustered together (left, p = 0.316), while the other nine matched 2D and 3D pairs were divided into two distinct clusters (right, p = 0.001). The significance was determined by PERMANOVA test. 2D: PDCCs; 3D, ALI organotypic cultures. F) Volcano plot of DEGs in 2D PDCCs (blue) versus 3D ALI organotypic cultures (red). Only 63 DEGs are present in the 2D and 3D pairs with similar gene expression profiles (left), while 2439 DEGs are present in the 2D and 3D pairs with significantly different gene expression profiles (right). Adjusted p‐value (<0.05) and log2 fold‐change (absolute value >1) are used to select DEGs. G) Bar plots of the enriched GO terms of upregulated genes in 3D ALI organotypic cultures derived from 2D and 3D pairs with significantly different gene expression profiles.
