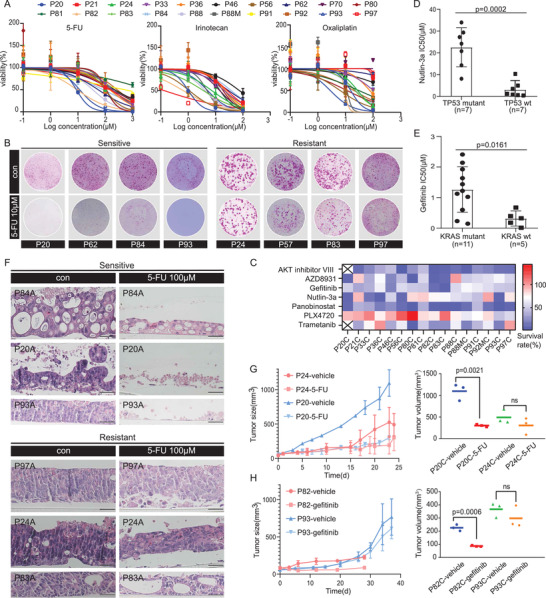
Figure 5.

The 2D and 3D model captures intertumoral heterogeneity of drug response. A) Dose–response curves after 6 days treatment of 20 PDCC lines with 5‐fluorouracil (5‐FU), oxaliplatin, and irinotecan generated from luminescence signals. n = 3, technical replicates. Value represents the mean ± SD. B) The functional phenotypes of drug response indicated by 2D PDCC colonies treated with 10 × 10−6 m 5‐FU. Four PDCC lines are sensitive, four PDCC lines are resistant. Cells were fixed, Rhodamine stained, and photographed after six days treatment. Three technical replicates for each PDCC line. C) Heatmap of dose response of seven drugs in PDCC lines (n = 16). The mean survival from triplicate experiments is displayed. D) Scatter plots of IC50 (µm) values after six days of treatment of PDCCs with nutlin‐3a in association with TP53 mutation status. All experiments are carried out in triplicate, and data are represented as means ± SD. Mutant PDCCs (circle, n = 7), wild‐type PDCCs (square, n = 7); p = 0.0002. The p‐value is calculated by two‐tailed Student's t‐test. E) Association of KRAS status and gefitinib response. All experiments are carried out in triplicate, and data are represented as means ± SD. Mutant PDCCs (circle, n = 11), wild‐type PDCCs (square, n = 5); p = 0.0161. The p‐value is calculated by two‐tailed Student's t‐test. F) H&E staining of ALI organotypic cultures derived from three sensitive PDCC lines show obviously damaged after treatment with 100 × 10−6 m 5‐FU for six days, while ALI organotypic cultures derived from three resistant PDCC lines show small changes. Three technical replicates are performed for each PDCC line, n = 6. Scale bar: 50 µm. G) In vivo activity of 5‐FU in xenografted tumors derived from PDCCs of P20 and P24 (nude mice, n = 3 per group). Mice were injected subcutaneously with PDCCs and treated when tumor volumes reached 50 mm3. A significant difference in tumor size between the 5‐FU and the vehicle treatment was observed in P20 (sensitive PDCCs), but no difference in P24 (resistant PDCCs). Results are shown as the tumor volume (mean ± SD). Tumor volumes are determined by measuring at the last time point (p = 0.0021; right). The p‐values are calculated by two‐tailed Student's t‐test. H) In vivo activity of gefitinib in xenografted tumors derived from PDCCs of P82 and P93 (nude mice, n = 3 per group). There was no difference between gefitinib and vehicle treatment in P93 (resistant PDCCs), while the growth rate of P82 PDCC (sensitive) derived xenografts treated with gefitinib was much slower than the control group (n = 3 per group). Results shown as tumor volume (mean ± SD). Tumor volumes are determined by measuring at the last time point (p = 0.0006; right). The p‐values are calculated by two‐tailed Student's t‐test.
