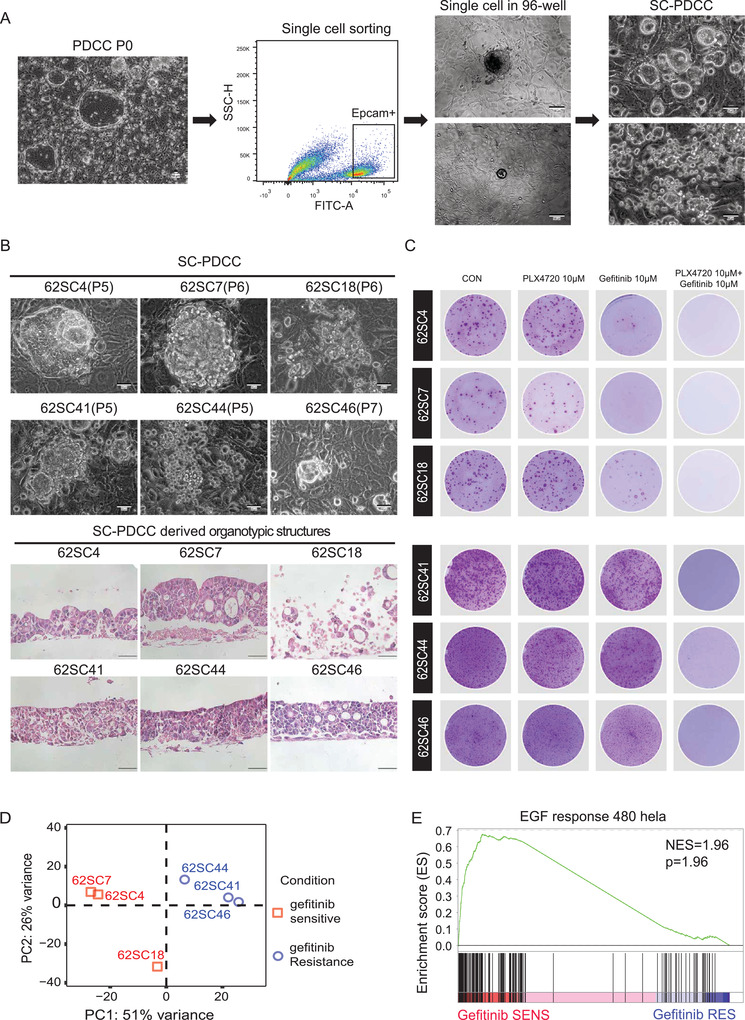
Figure 6.

SC‐PDCC clones capture intratumoral heterogeneity of drug response. A) Schematic procedure of establishing SC‐PDCC clones from CRC patient. Colonies were generated after processing tissues (PDCC P0). Scale bar: 50 µm. Then cells were sorted using EPCAM+ to obtain single cell per well. Scale bar: 100 µm. SC‐PDCC clones were established after expansion. Scale bar: 50 µm. B) Representative bright field microscopy images of SC‐PDCC colonies and H&E images of SC‐PDCCs derived ALI organotypic cultures. Passage numbers were marked in brackets. Scale bar: 50 µm. C) Rhodamine staining showing that all SC‐PDCC clones of P62 are resistant to 10 × 10−6 m PLX4720, but their responses to gefitinib are different. All PLX4720 resistant SC‐PDCC clones are sensitive to the combination of 10 × 10−6 m PLX4720 and 10 × 10−6 m gefitinib. Three technical replicates are performed for each clone. D) PCA showed that SC‐PDCC clones with different response to gefitinib are separated into two groups. E) GSEA showing the significantly enriched EGF response pathway in gefitinib sensitive SC‐PDCC clones.
