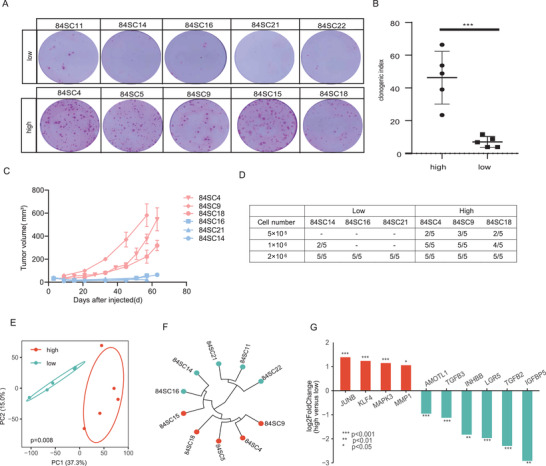
Figure 7.

SC‐PDCC clones capture intratumoral heterogeneity of tumorigenicity. A) Rhodamine staining showing the clonogenicity assay of colonies grown 15 days on feeder cells following seeding 1000 single cells per well from each SC‐PDCC clone of P84 patient; n = 3, biological replicates. B) Quantification of clonogenicity based on percentage of colony formation; n = 3, biological replicates data represented as mean ± SD. p < 0.0001. C) The growth curve of the xenograft generated from SC‐PDCC clones with different tumorigenicity (nude mice, n = 5 per SC‐PDCC clone). Red represents high tumorigenicity, blue represents low tumorigenicity. D) Table summarizing the number of injected cells of the SC‐PDCC clones in P84, as well as the proportion of xenograft formation. E) PCA showed that SC‐PDCC clones with high or low tumorigenicity were separated into two groups. p = 0.008. F) Unsupervised hierarchical clustering was performed on SC‐PDCC clones with high or low tumorigenicity. G) Top upregulated DEGs in SC‐PDCC clones with high tumorigenicity (red) and SC‐PDCC clones with low tumorigenicity (blue). **** adjust P < 0.0001, *** adjust P < 0.001, ** adjust P < 0.01, * adjust P < 0.05, based on RNA‐seq data.
