
Figure 6.
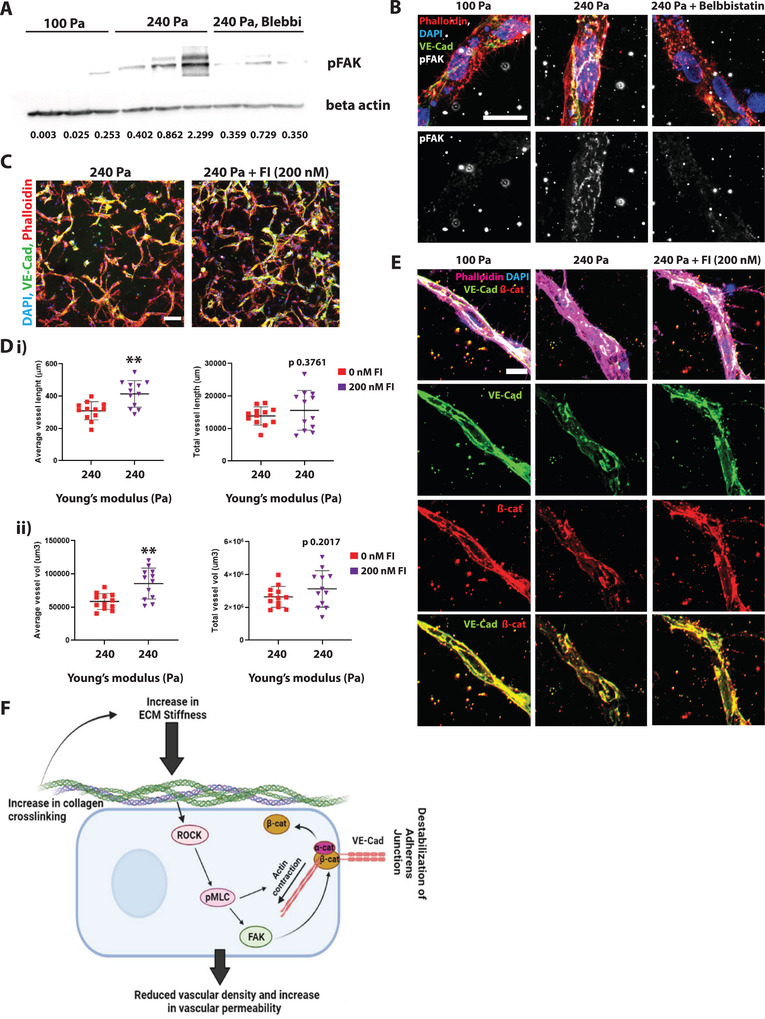
Inhibition of cell contractility reduces pFAK levels, thus recovering the vascular phenotype: A) Western blot and quantifications for pFAK levels in the soft (100 Pa) and stiffened (240 Pa) hydrogels. pFAK levels were normalized to beta‐actin are shown below the bands. B) Representative confocal images of maximum projection 24 h post‐crosslinking. pFAK levels are increased in samples subjected to stiffness increase, as shown by larger pFAK clusters (arrows). Treatment with Blebbistatin reduces pFAK levels (DAPI in blue, phalloidin in red, VE‐Cad in green, and pFAK in gray). The scale bar is 20 µm. C) Representative confocal images of maximum Intensity projection of stiffened hydrogels in the presence of 200 × 10−9 m FAK inhibitor show rescue on D,i) vessel length and D,ii) vessel volume. E) Representative confocal images show rescue of adherens junctions in FAK inhibitor (200 × 10−9 m) treated vessels (VE‐Cad in green, β‐catenin in red, DAPI in blue, and phalloidin in magenta). The bottom images show an overlay of the VE‐Cad and β‐catenin channels. Scale bar is 20 µm. Significance levels were set at p > 0.05, *p ≤ 0.05, **p ≤ 0.01. F) Schematic of the suggested pathway showing that pMLC regulates vascular phenotype in a FAK‐dependent manner in stiffening matrix.