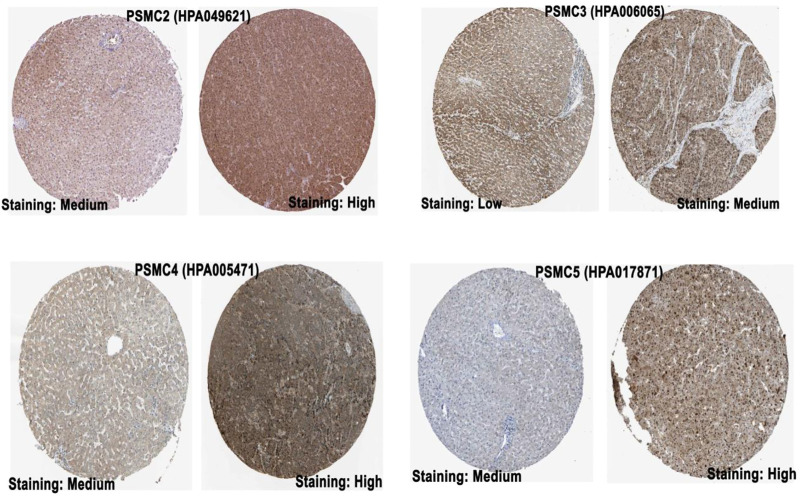
FIGURE 3.
IHC images (visualized at 200 µm) delineating the protein level expression of PSMCs in normal lung (left) and LUAD tissue (right) from the HPA server. The name of the corresponding antibody used for IHC staining has been indicated inside the parentheses in addition to the gene name. The representative image for PSMC1 was not found (Source: The Human Protein Atlas; https://www.proteinatlas.org/).

