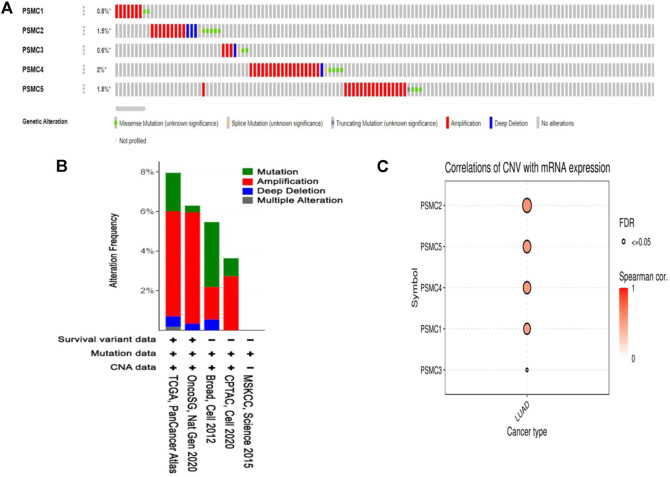
FIGURE 5.
Mutation analysis report on PSMC genes in LUAD patients presented in OncoPrint diagram (A). The colored region of the column represents different alterations, and the alternation frequency is a fraction of the colored columns over the total columns. Amplification was found to be the most prevalent form of genetic alteration in all PSMC genes across different LUAD studies. The distribution of mutation and CNA in PSMC genes across different LUAD studies is oriented in bar diagram (B). The y-axis represents the percentage of total samples mutated in each LUAD study correspondingly presented in the x-axis. Bubble plot representing the positive correlation between the CNAs present in PSMC genes and their mRNA level expression in LUAD tissues (C).

