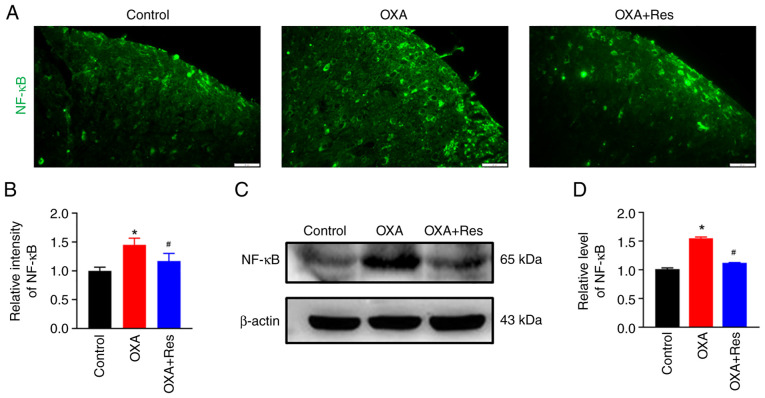
Figure 5.
Res treatment decreases NF-κB expression. (A) Representative immunofluorescence staining images of spinal NF-κB in the Control, OXA and OXA + Res groups (scale bar, 20 µm). (B) Quantitative data analysis of NF-κB fluorescence intensity presented as the mean ± SD (n=3). *P<0.05 vs. Control. #P<0.05 vs. OXA. (C) Western blot analysis of NF-κB in the spinal cord of Control, OXA and OXA + Res groups. (D) Semi-quantitative data analysis of NF-κB expression presented as the mean ± SD (n=3). *P<0.05 vs. Control. #P<0.05 vs. OXA. OXA, oxaliplatin; Res, resveratrol.

