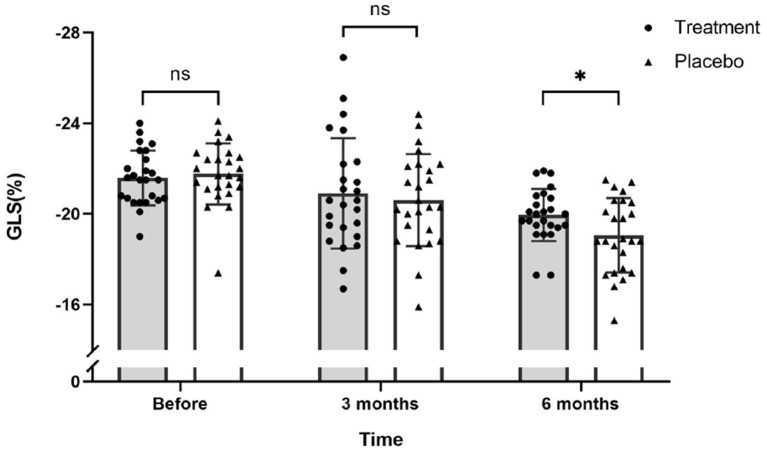
Figure 4.
Scatter plot for GLS values of 51 patients on the day before chemotherapy, 3 months after the first round of chemotherapy and 6 months after the first round of chemotherapy. There was no significant difference in GLS values between the treatment and placebo groups before and after 3 months of chemotherapy. After 6 months of chemotherapy, the GLS values of the treatment group was significantly higher than the placebo group (ns, not significant; *P ≤ 0.05).

