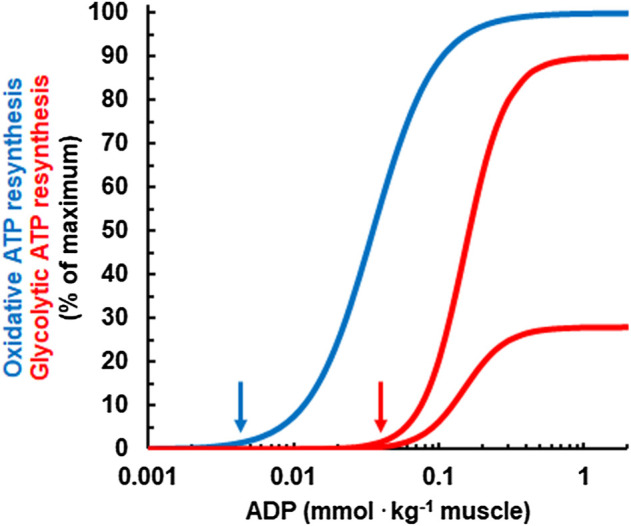
FIGURE 2.

Relationship between the concentration of ADP and the simulated, relative rates of oxidative (blue) and glycolytic ATP resynthesis (red) for a pH of 7 (upper red curve) and for a pH of 6.4 (lower red curve). Note that ADP needs to rise to higher concentrations for glycolytic ATP resynthesis to kick in than for oxidative ATP resynthesis. This is an important feature for the regulation of human energy metabolism and explains why oxidative ATP resynthesis is dominant at rest and during low intensity exercise. Moreover, as an acid pH inhibits phosphofructokinase, the rate of glycolytic ATP resynthesis at a given ADP concentration is lower if the pH is in reduced. In the model, the maximal rate of glycolytic ATP resynthesis is reached at a pH of 7.4 which is not shown in the figure.
