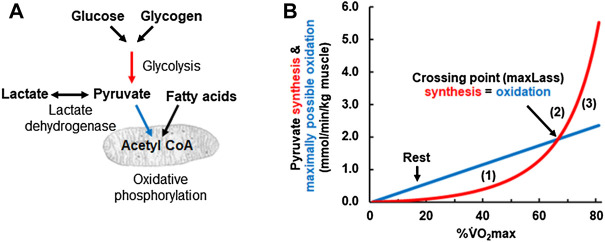
FIGURE 3.
(A) Schematic drawing of the pathways simulated in Panel 3 (B). Red arrow refers to glycolytic ATP resynthesis or pyruvate synthesis, the glycolytic flux rate νLa. The blue arrows refer to the oxidative ATP resynthesis or the maximally possible rate of pyruvate oxidation, the oxidative flux (V̇O2). (B) Calculated glycolytic pyruvate (and lactate) synthesis [red arrow in (A) and red line in (B)] and maximally possible rate of pyruvate (and lactate) oxidation at different exercise intensities expressed as a percentage of the O2max. (1) is the zone where glycolytic pyruvate synthesis is below the maximally possible rate of pyruvate oxidation by oxidative phosphorylation. In this area, the pyruvate deficit allows either fat oxidation to fuel the substrate demand of oxidative metabolism or the uptake of pyruvate via previously accumulated lactate. Point (2) is the crossing point where glycolytic pyruvate and lactate synthesis match the maximally possible rate of pyruvate oxidation at a given workload. This point indicates the maxLass. In contrast, (3) is the zone glycolytic flux and the resulting pyruvate synthesis exceeds the maximally possible rate of pyruvate oxidation. As a consequence, pyruvate and lactate accumulate.

