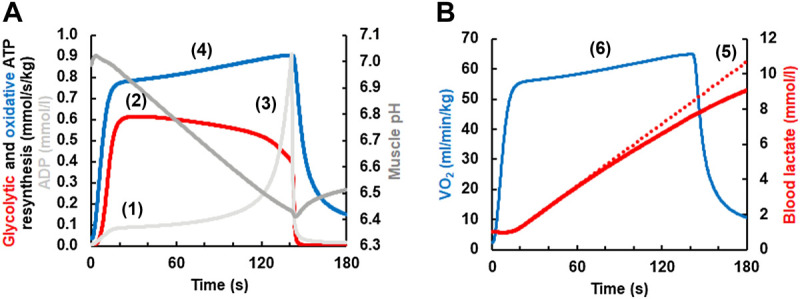
FIGURE 4.

(A) Simulation of the V̇O2 slow component simulated with a current version of the Mader human exercise metabolism model. At the onset of exercise, the concentrations of ADP and AMP (not shown) increase (1). This stimulates phosphofructokinase and thereby increases the rate of glycolytic ATP resynthesis and lactate formation, reaching a maximum in-between 20–40 s (2). As the concentration of muscle lactate increases (B), muscle pH becomes increasingly acid from ≈20 s onwards (3). As an acid pH inhibits phosphofructokinase (Panel 4A) and thereby glycolytic ATP resynthesis, the rate of glycolytic ATP resynthesis declines after its maximum in-between ≈ 20–40 s even though the concentrations of ADP and AMP (not shown) rise greatly just before fatigue. Because glycolytic ATP resynthesis declines, oxidative ATP resynthesis must rise to meet the constant ATP hydrolysis during constant load exercise (4) (the contribution of ATP resynthesis from phosphocreatine is incorporated in the model but not shown). If the efficiency would worsen, then the slow component would increase further. Panel 4B On a whole body level, the reduction in the rate of glycolytic ATP resynthesis and lactate formation is seen (5) as a less than linear increase of the lactate concentration (the dotted line plots an increase of lactate at the rate that is reached in-between 20–40 s). The slow component of oxidative ATP resynthesis in (A) is seen as a corresponding slow component of the V̇O2 in (B) (6).
