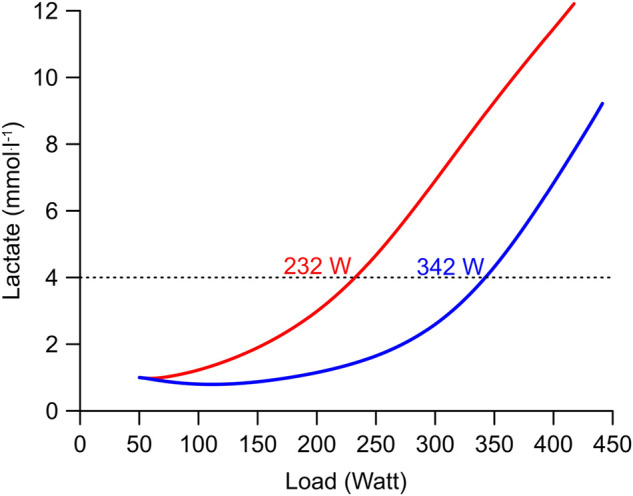
FIGURE 5.

Simulation of a graded exercise test of two subjects with extreme differences of their νLa.max but equal O2max (65 ml min−1 kg−1). The lactate curves are simulated using the revised version of Mader’s human exercise metabolism model (Mader, 1984; Mader, 2003). The first subject (blue curve) has a low maximal glycolytic rate (νLa.max) of 0.3 mmol.L−1 s−1. The second subject (red curve) has a νLa.max of 1.0 mmol.L−1 s−1.
