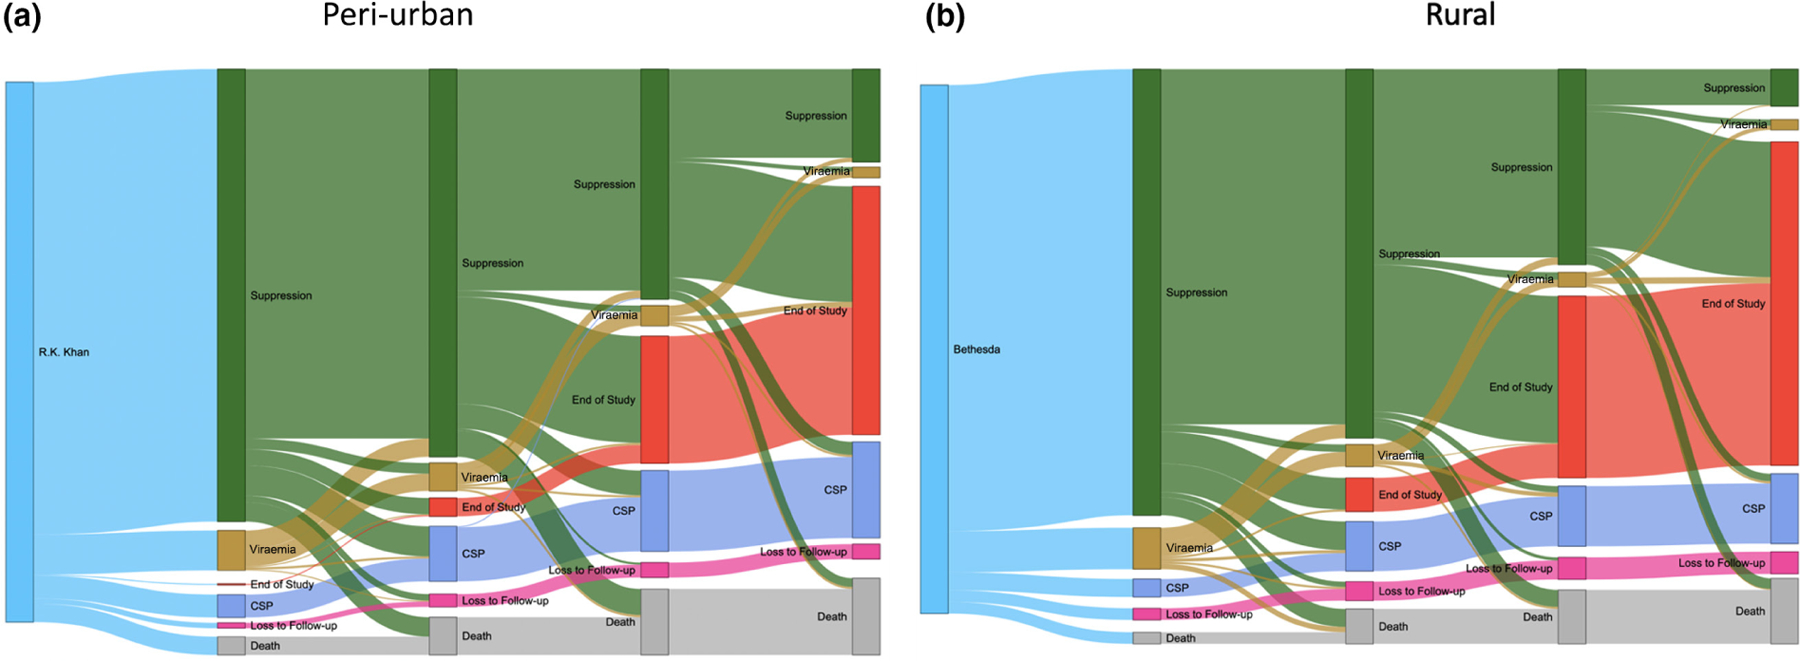
FIGURE 1.

(a, b) Retention and viral load suppression at each viral load monitoring visit at the R.K. Khan Hospital clinic (a) and Bethesda Hospital clinics (b). The disposition of each participant at the time of viral load testing and how their disposition changes between each test are illustrated. The vertical nodes define disposition when viral load testing was due, and the grey ‘flows’ identify the proportion of participants from the previous nodes that flow into subsequent nodes
