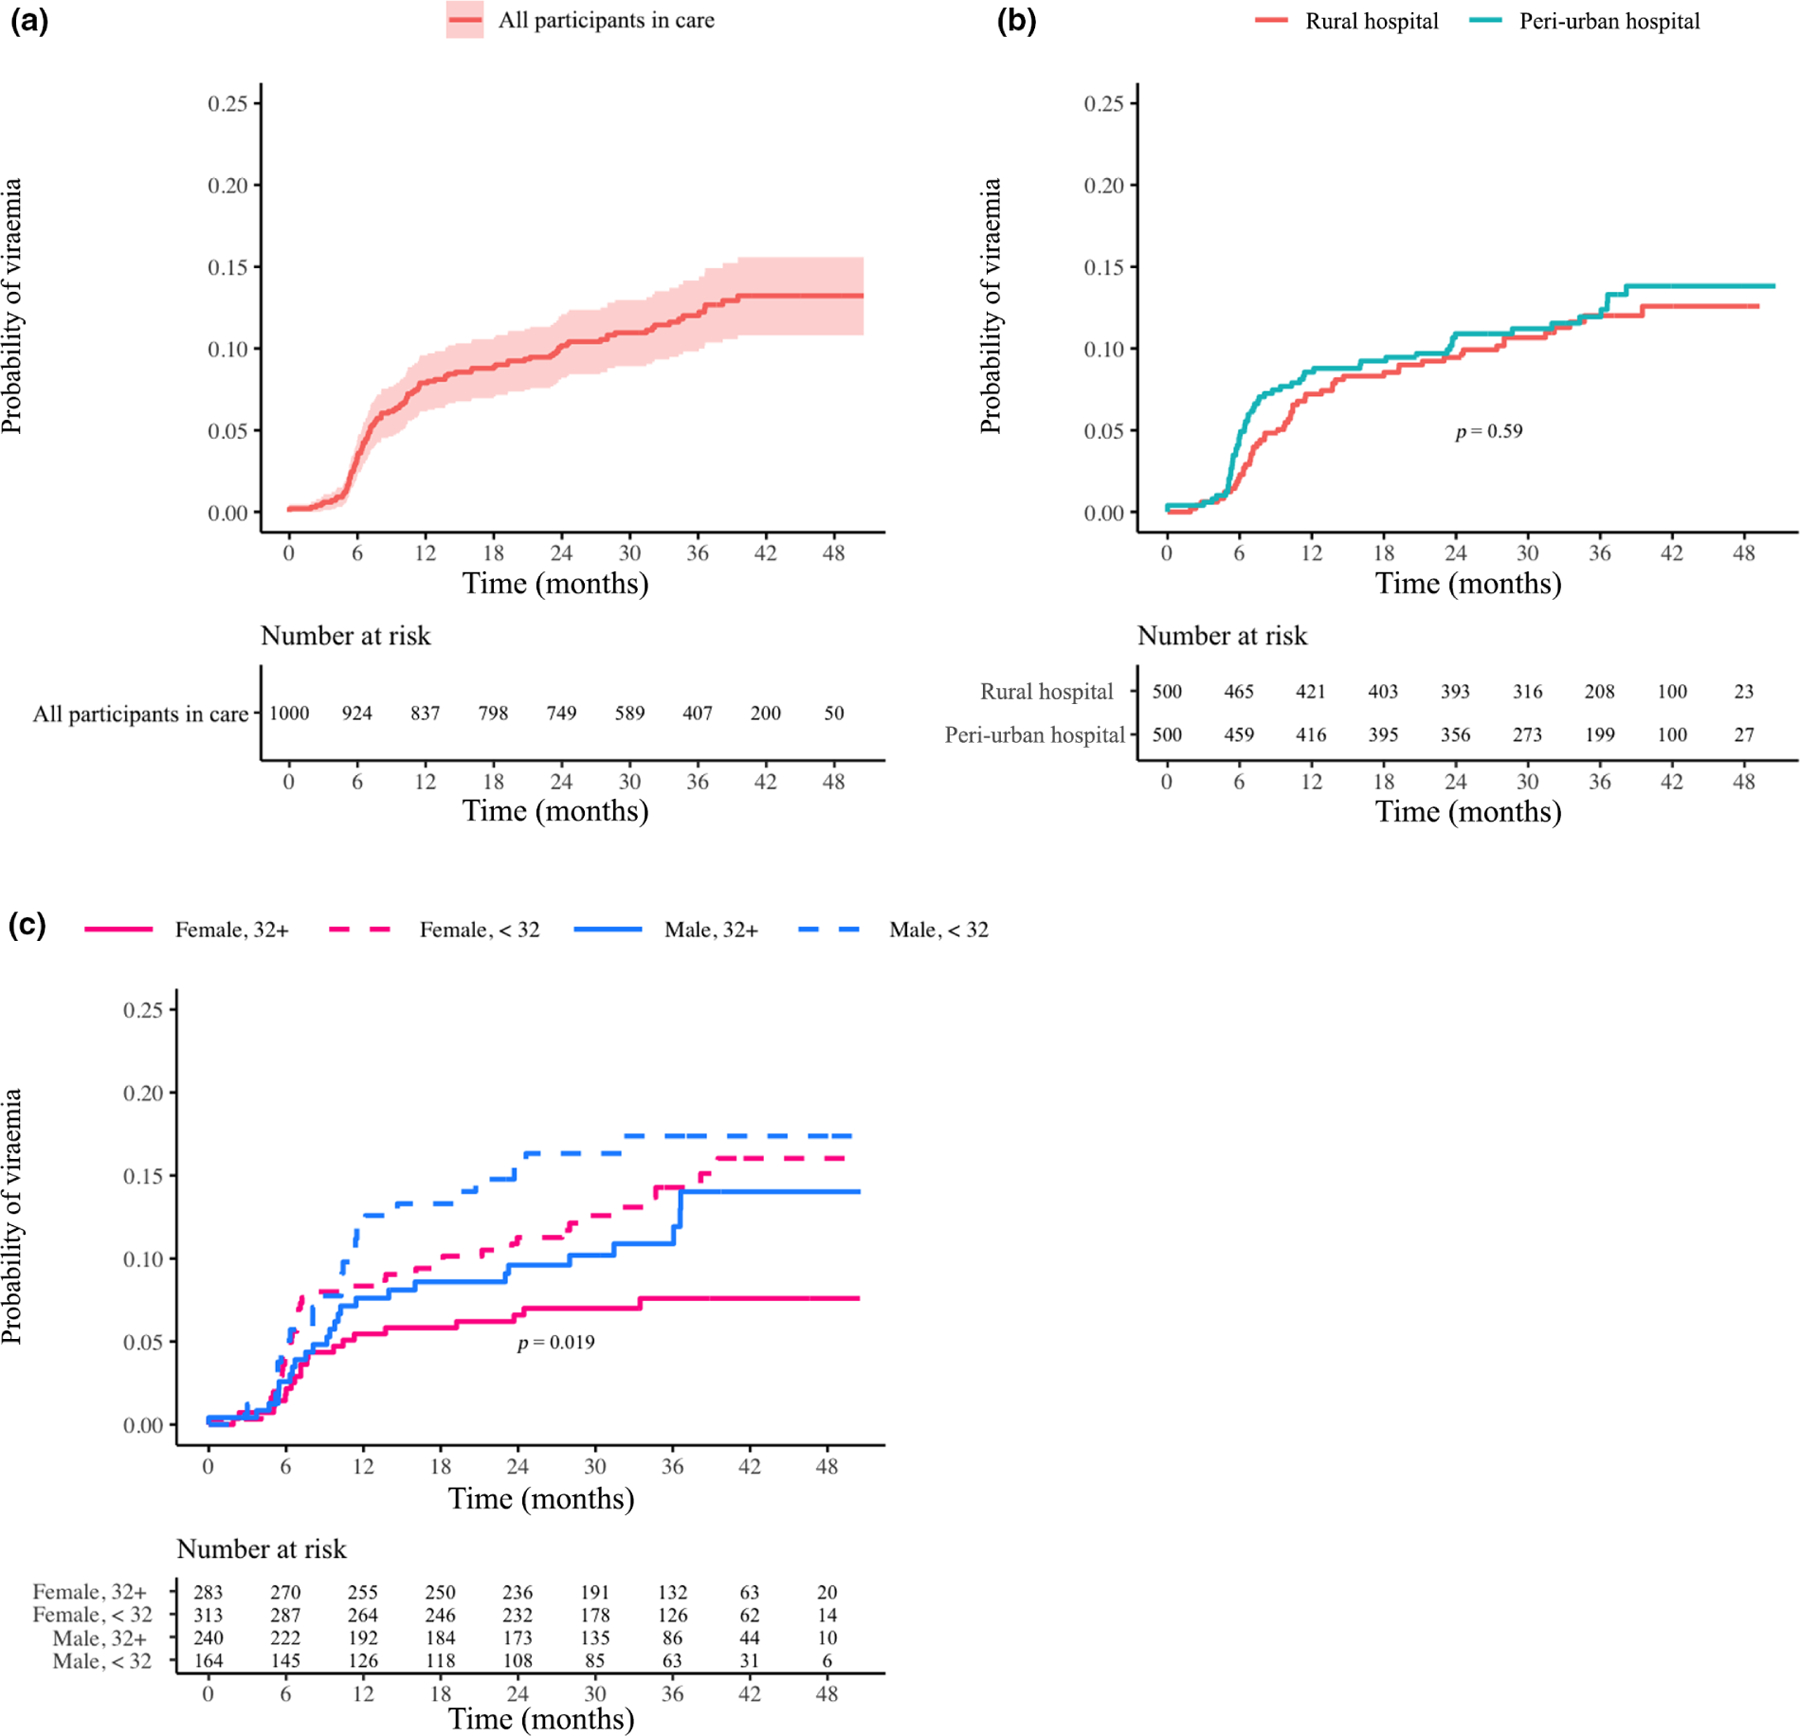
FIGURE 4.

(a–c) Probability of virological failure (viral load > 1000 copies/ml) for participants in care overall (a), by site (b) and by age/gender (c). Log-rank p-values are provided if significant (< 0.05). The underlying assumption was that at 5 months after enrolment every participant should have achieved a state of virological suppression. Therefore, the time interval extended from participant enrolment until the end of the study with date of first failure event as the event date. Censoring occurs for those who became uncontactable or died
