FIGURE 2.
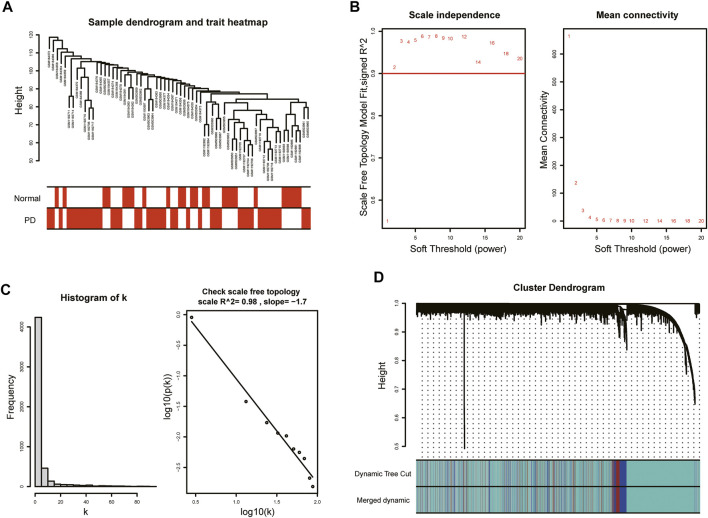
WGCNA of GSE7621, GSE20141, and GSE49036. (A) Sample dendrogram and trait heatmap. (B) The values of soft-threshold power based on scale independence and mean connectivity. The soft-threshold power was selected as 5 to satisfy the criteria of scale-free topology. (C) Check scale-free topology. The correlation coefficient of the connection degree k and p(k) was 0.98, indicating scale-free topology was constructed. (D) Cluster dendrogram of genes. Each color represented a module, and the gray module included the genes that could not be classified into any module.

