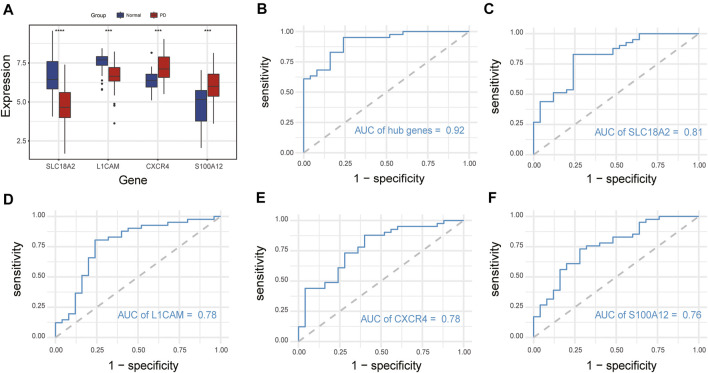
FIGURE 7.
Expression of immune-related hub genes and ROC curve of immune-related hub genes. (A) Expression of hub genes in 41 PD and 25 healthy control samples. (B) The ROC curve of four immune-related hub genes. (C–F) The ROC curve of each immune-related hub gene. ns, p > 0.05, *p < 0.05, **p < 0.01, ***p < 0.001, ****p < 0.0001.

