Figure 3.

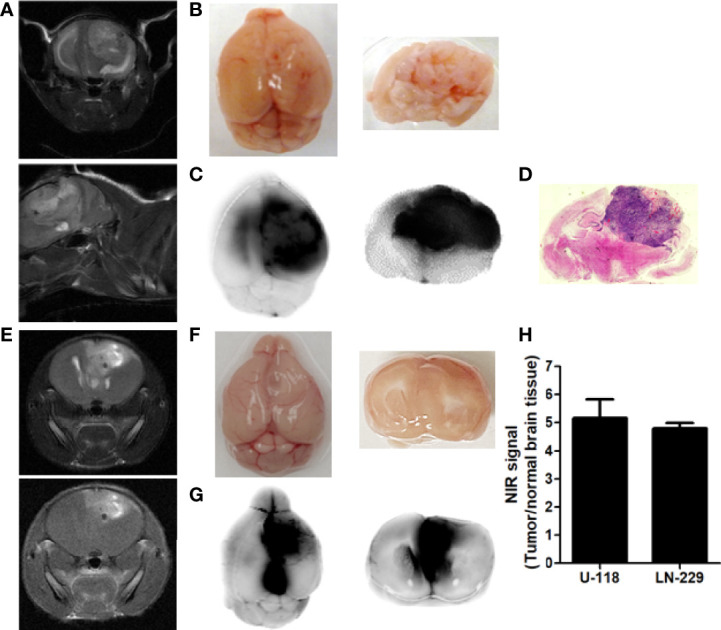
Preferential localization of p28 at tumor in the brain. MR images of the brains indicated U118 (A), coronal (upper) and sagittal (lower) sections of T2-weighted images) and LN-229 tumor growth (E: upper: coronal section of T2-weighted image. lower: T1-weighted image) in the brain. Mice bearing tumor received ICG, a near-infrared red fluorescent dye conjugated with p28 at 0.5 mg/kg i.v. After 24h, fluorescence images of the brain were recorded (B, F): white light photo, (C, G): NIR fluorescence). Specific NIR signal at 800 nm was represented as direct fluorescence showing preferential localization of p28 at tumors. (D). The paraffin-embedded brain sections were stained by H, E. (H), The signal-to-background ratio (signal at 800 nm: tumor, background noise: surrounding brain tissue) was calculated. N=3 in each cell line, Mean+SD.
