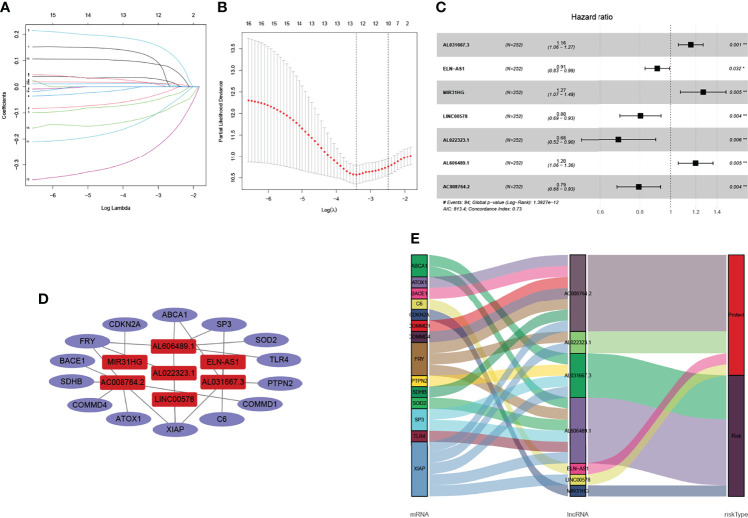
Figure 3.
Identification of cuproptosis-related lncRNAs and co-expression network construction. (A, B) LASSO Cox algorithm was employed to establish a prognosis model. The color depth of the nodes depicted the corrected P-value of ontologies. The size of the nodes depicted the number of genes that are engaged in the ontologies. (C) A total of 7 lncRNAs were selected through subsequent multivariate analysis to construct the risk model. (D) Co-expression structure between cuproptosis-related lncRNAs and genes. (E) Sankey diagram was used to visualize the co-expression network.

