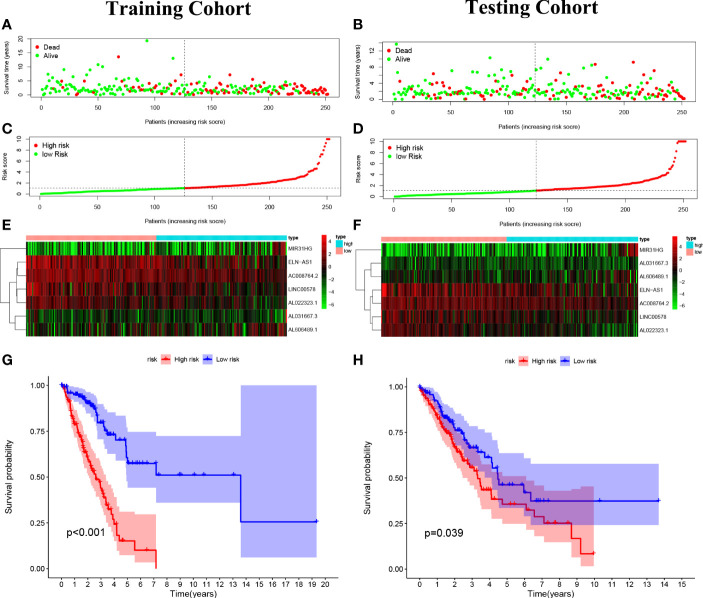
Figure 4.
Construction of the predictive risk model in lung adenocarcinoma (LUAD) patients. (A, B) The risk score was calculated by 7 cuproptosis-related lncRNAs in the two cohorts (training and validation), and two risk groups were formed in LUAD patients. Green, low risk; red, high risk. (C, D) Survival status of LUAD patients. Green: survival; red: death. (E, F) The heat map indicates the expression degrees of 7 cuproptosis-related lncRNAs. (G, H) The Kaplan–Meier analysis revealed the overall survival in the two risk groups.

