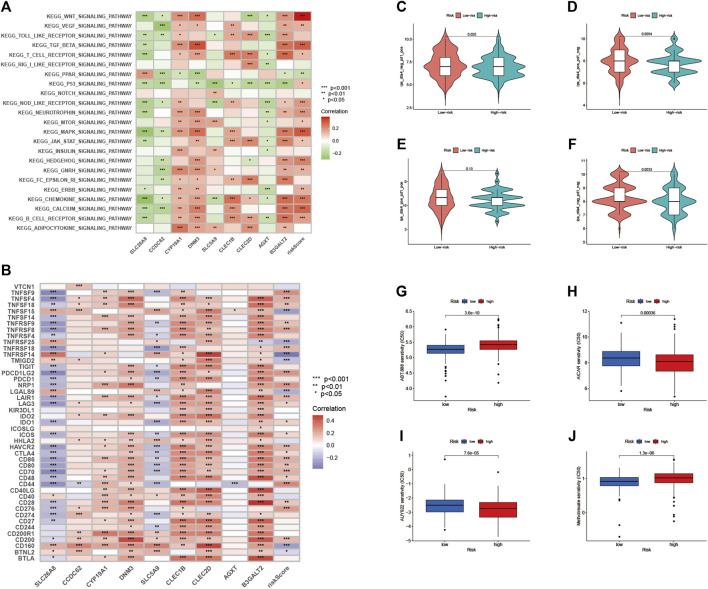
FIGURE 10.
Enrichment pathways for GSVA (A) heatmap showing the correlation of representative pathway items on KEGG with risk scores. Predicting immunotherapy response (B) Association of immune checkpoint blockade gene expression levels with risk scores (C–F) IPS score distribution map. Estimates of chemotherapy effect risk scores. Sensitivity analysis of (G) Veliparib in patients with high and low risk scores. Sensitivity analysis of (H) cisplatin in patients with high and low risk scores (I) Sensitivity analysis of paclitaxel in patients with high and low risk scores (J) Sensitivity analysis of methotrexate in patients with high and low risk scores.

