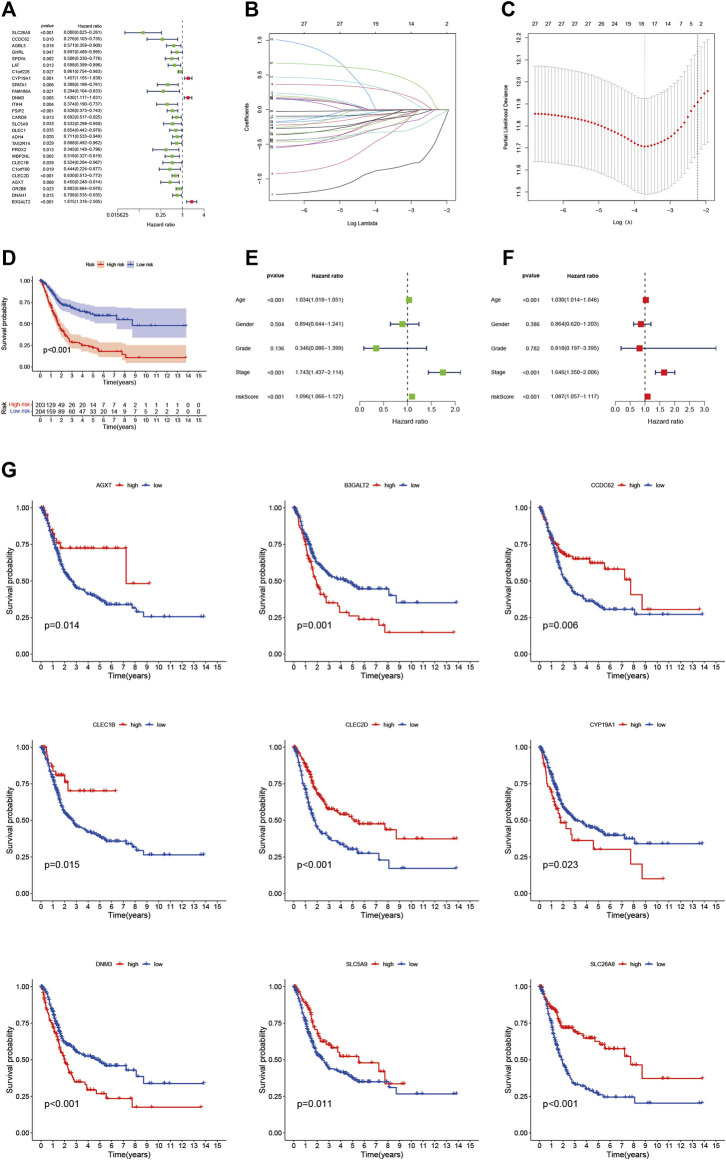
FIGURE 3.
(A) Nomogram between 27 eosinophil-related genes and overall survival screened by univariate Cox regression analysis (B) LASSO coefficient profiles of 22 candidate genes. A vertical line is drawn at the value chosen by 10-fold cross-validation (C) Ten-fold cross-validation for tuning parameter selection in lasso regression. Vertical lines are drawn from the best data according to the minimum criterion and 1 standard error criterion. The vertical lines on the left represent the final 9 genes identified (D,G) Kaplan-Meier curve analysis showing the difference in overall survival between high-risk and low-risk groups (E) Univariate Cox regression results for overall survival (F) Multivariate Cox regression results for overall survival.

