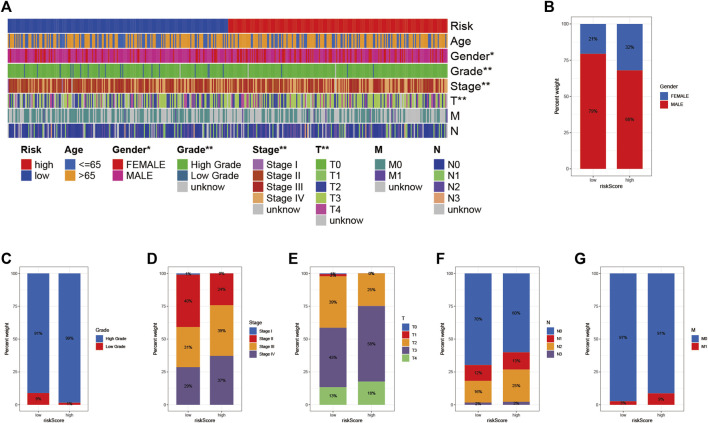
FIGURE 6.
Clinical significance of prognostic risk characteristics (A) heatmap showing the distribution of clinical characteristics and corresponding risk scores in each sample. Incidence of clinical variable subtypes of LRG/HRG (B) Gender (C) Grade (D) Stage (E) Stage T (F) Stage N, and (G) Stage M.

