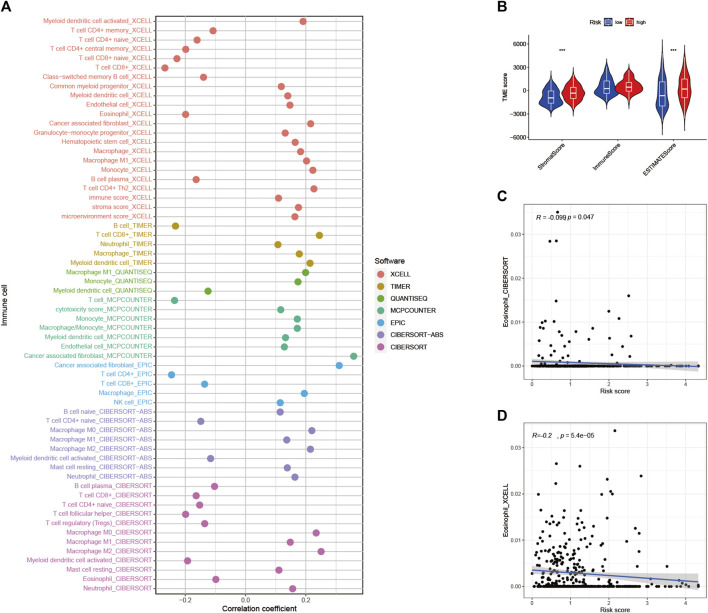
FIGURE 9.
Estimated abundance of tumor-infiltrating cells. Patients in the (A) high-risk group had a stronger correlation with tumor-infiltrating immune cells, as shown by the Spearman correlation analysis (B) Association between prognostic risk signatures and central immune checkpoint genes. The correlations predicted by the two methods CIBERSORT (C) and XCELL (D) were validated.

