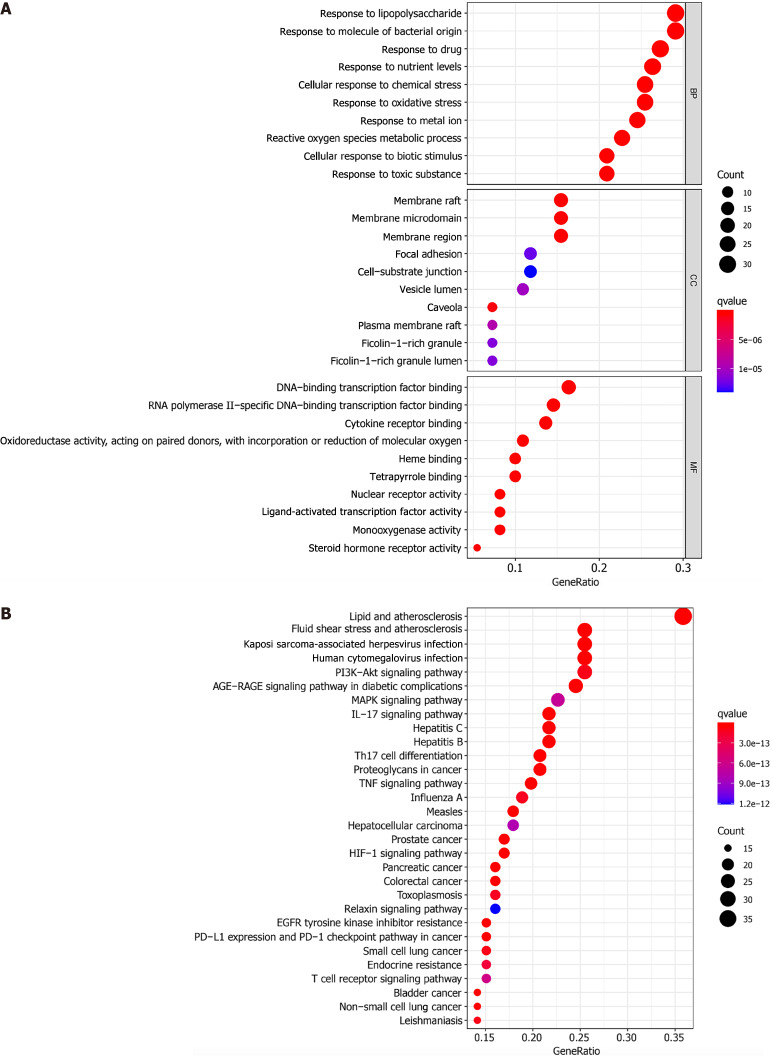
Figure 5.
Enrichment analysis. In the bubble chart, the ordinate is the name of the biological process or pathway, the abscissa is the proportion of genes, the size of the bubble represents the number of genes enriched in each gene ontology, and the color represents the significance of the enrichment. A: The Gene Ontology enrichment analysis indicates the biological response, gene distribution, and molecular function in which the target gene is mainly involved; B: The Kyoto Encyclopedia of Genes and Genomes enrichment analysis indicates the main pathway in which the target gene has a role. GO: Gene Ontology; KEGG: Kyoto Encyclopedia of Genes and Genomes; AGE-RAGE: Advanced glycation end products/receptor of AGE; TNF: Tumor necrosis factor; MAPK: Mitogen-activated protein kinase; HIF-1: Hypoxia-inducible factor 1; EGFR: Endothelial growth factor receptor; PD-L1: Programmed death-ligand 1; PD-1: Programmed cell death protein 1.

